Fig. 3
Download original image
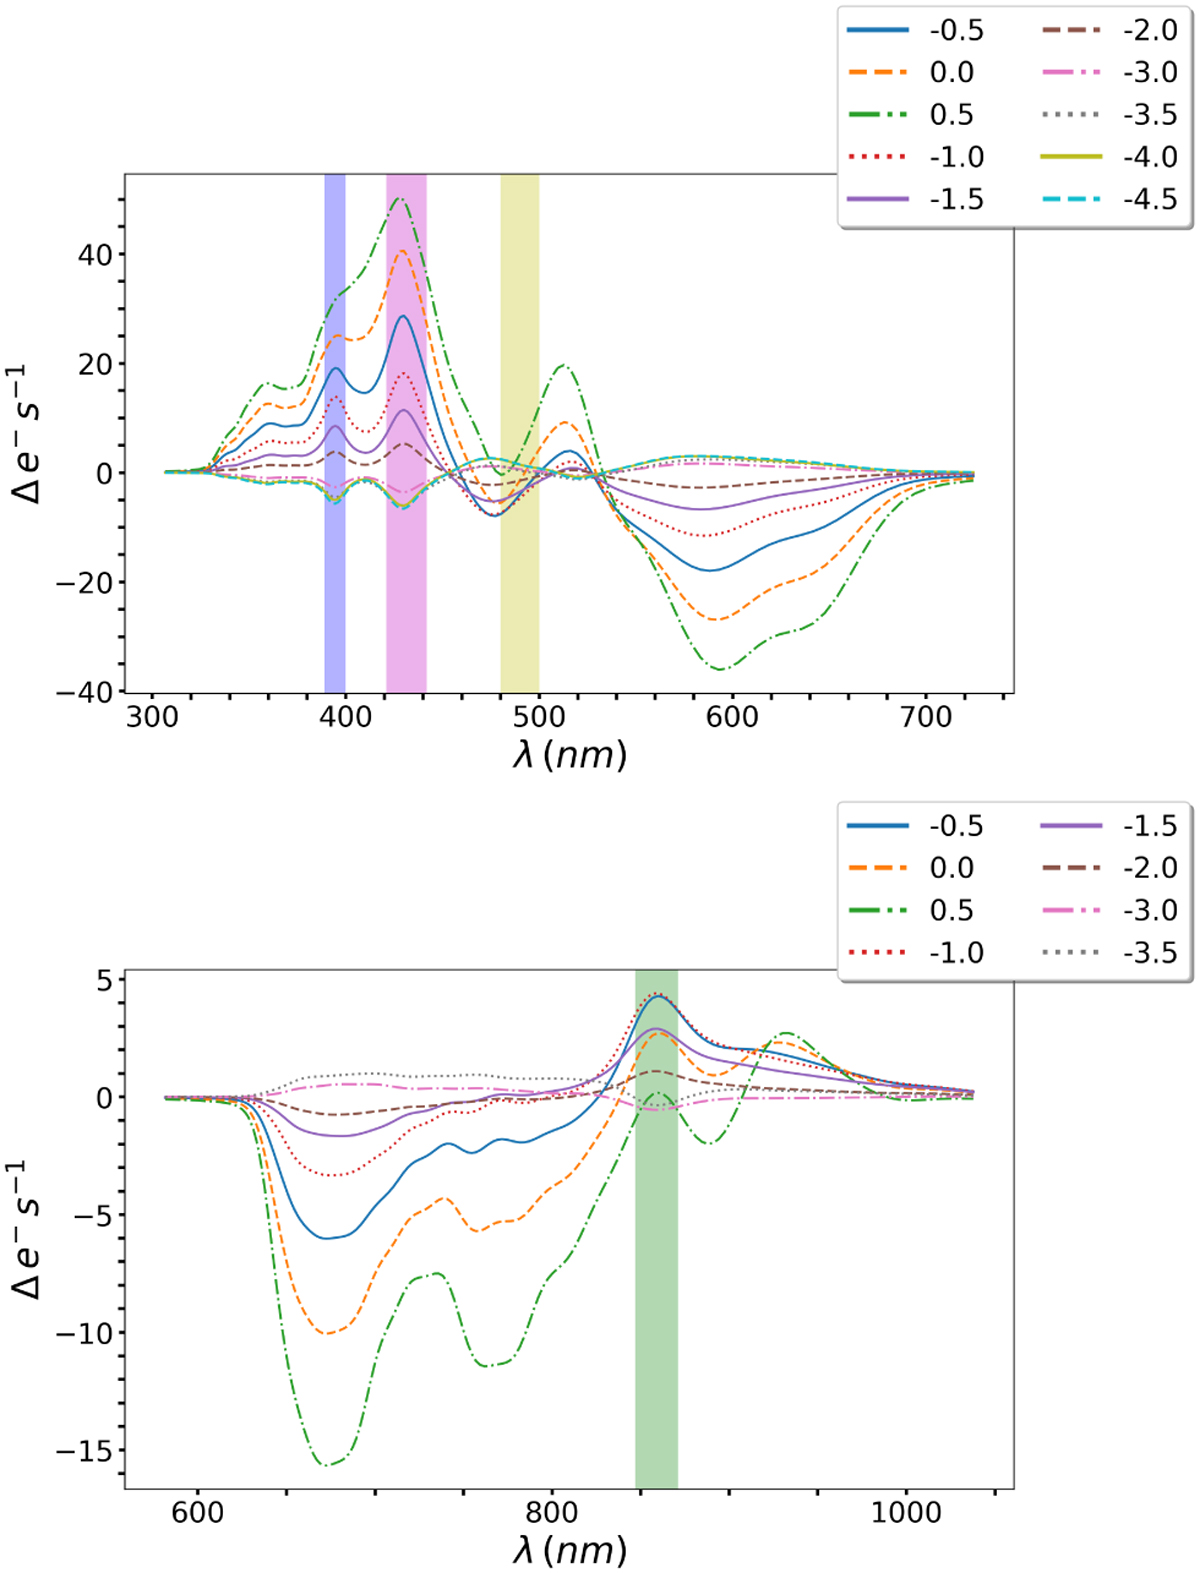
Differential BP (top panel) and RP (bottom panel) spectra of Solar [C/Fe]-scaled stars, with different [Fe/H]. Each differential spectrum results from reference spectrum – spectrum, where [Fe/H]ref = −2.5. The shaded areas correspond to the regions we used for our flux ratios, i.e., the Ca II H & K region (purple), the G-band (magenta), the Hβ (yellow), and the Ca II NIR (green) regions.
Current usage metrics show cumulative count of Article Views (full-text article views including HTML views, PDF and ePub downloads, according to the available data) and Abstracts Views on Vision4Press platform.
Data correspond to usage on the plateform after 2015. The current usage metrics is available 48-96 hours after online publication and is updated daily on week days.
Initial download of the metrics may take a while.