Fig. 2
Download original image
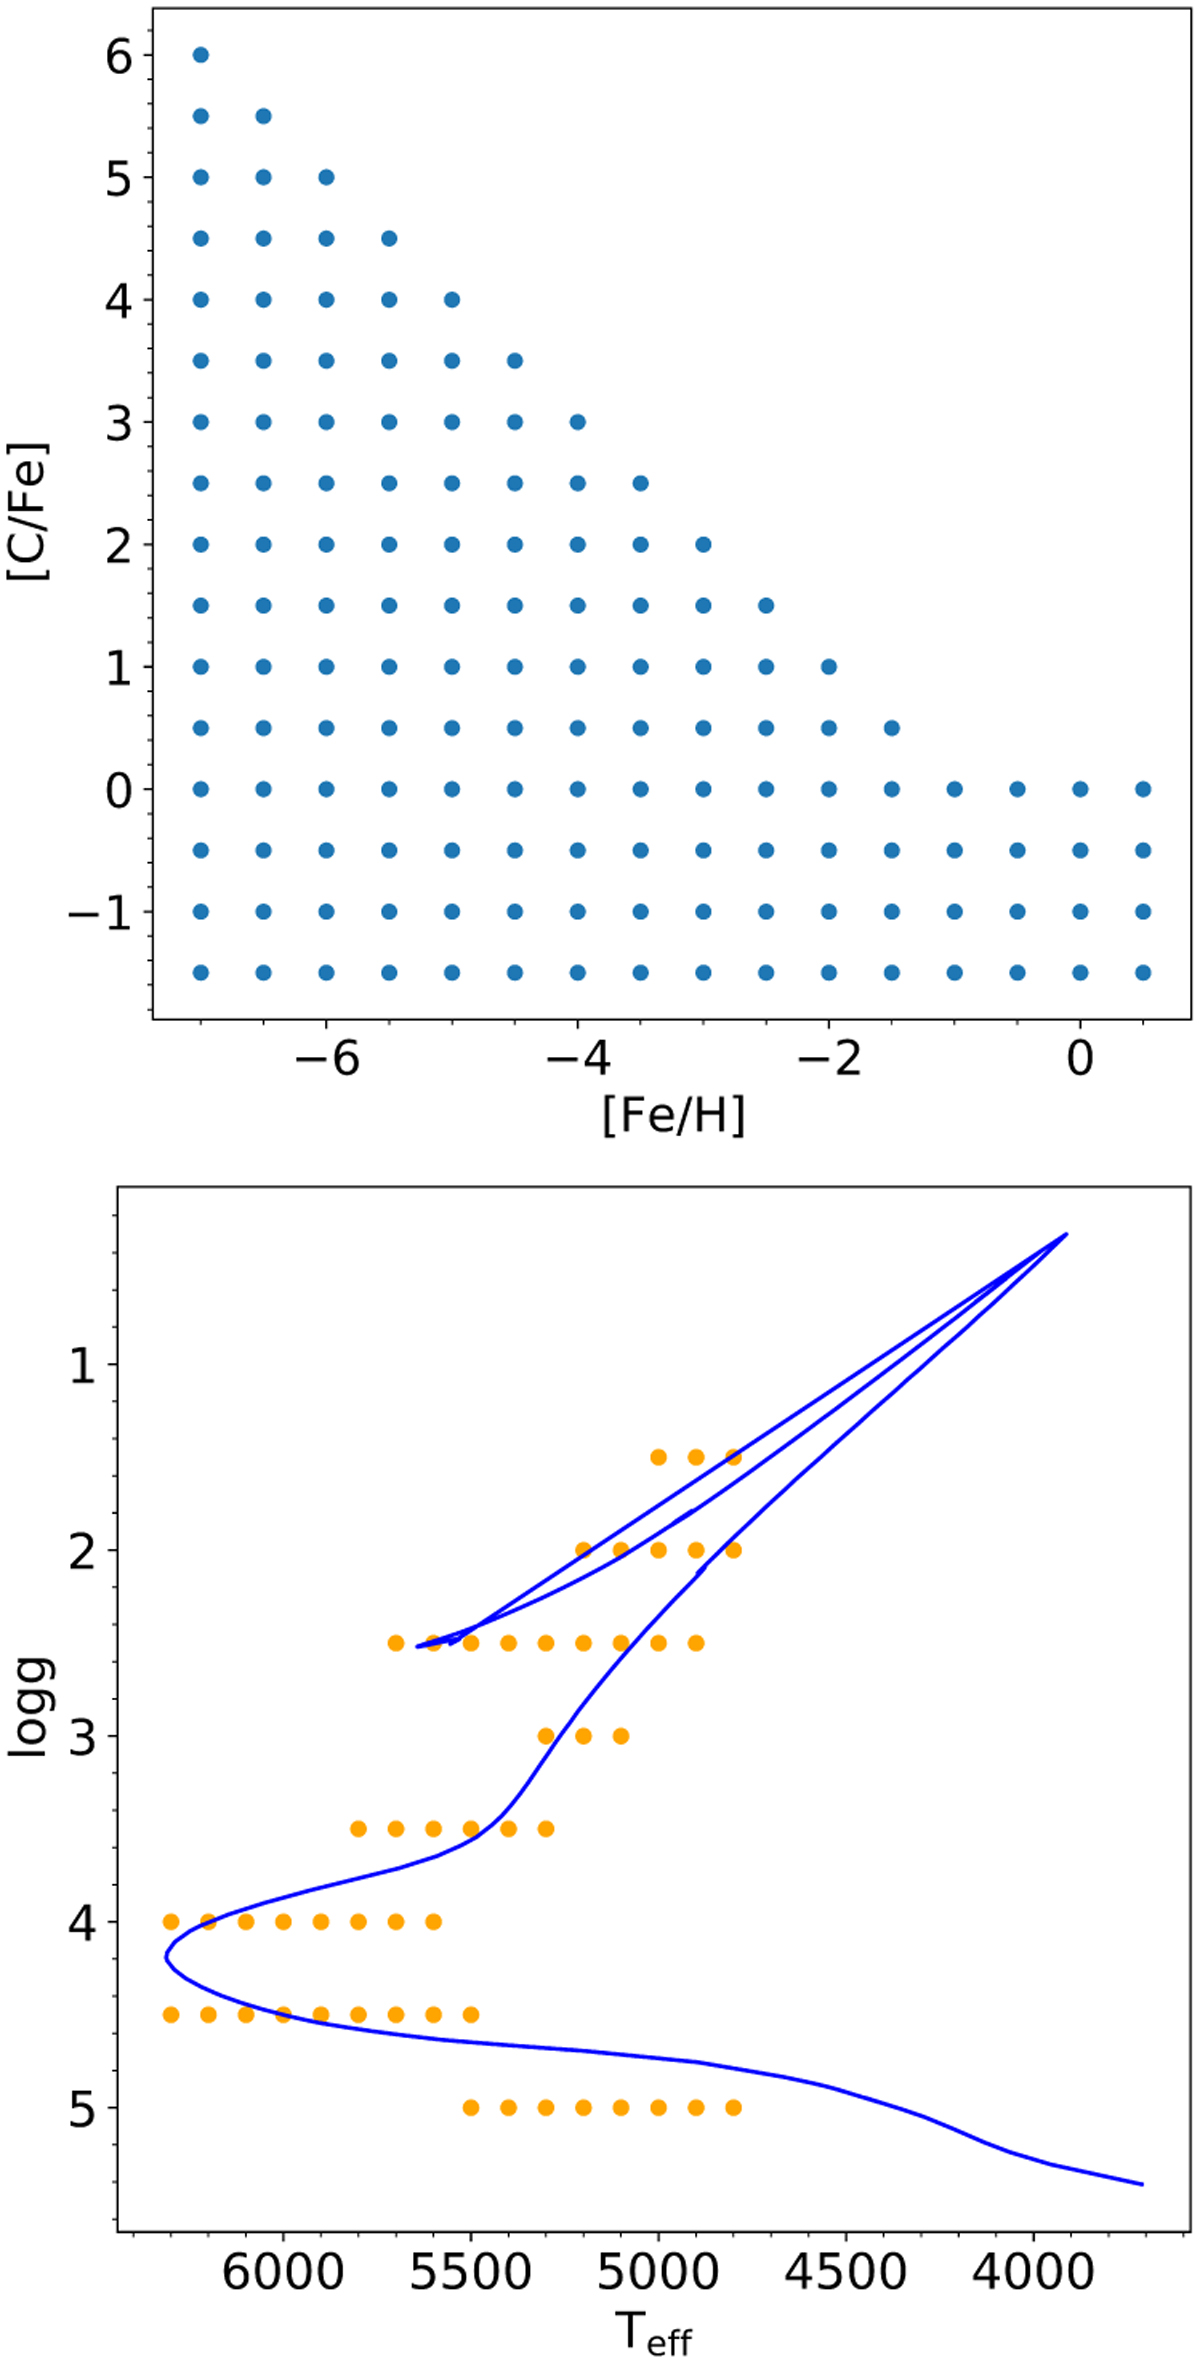
Parameter space we used to develop our method. Top plot: each point in the top plot represents a specific combination of relative carbon and iron abundances. Our entire dataset is comprised of all the meaningful temperature and surface gravity combinations (see bottom plot) for each and every one of these relative abundance combinations. Bottom plot: a PARSEC isochrone of 12 Gyr and [Fe/H] = −3.0 dex, which we used to determine the astrophysical parameters of our preliminary dataset. Overplotted are the temperature-surface gravity pairs of the final parameter space we used to develop our method.
Current usage metrics show cumulative count of Article Views (full-text article views including HTML views, PDF and ePub downloads, according to the available data) and Abstracts Views on Vision4Press platform.
Data correspond to usage on the plateform after 2015. The current usage metrics is available 48-96 hours after online publication and is updated daily on week days.
Initial download of the metrics may take a while.