Fig. A.1
Download original image
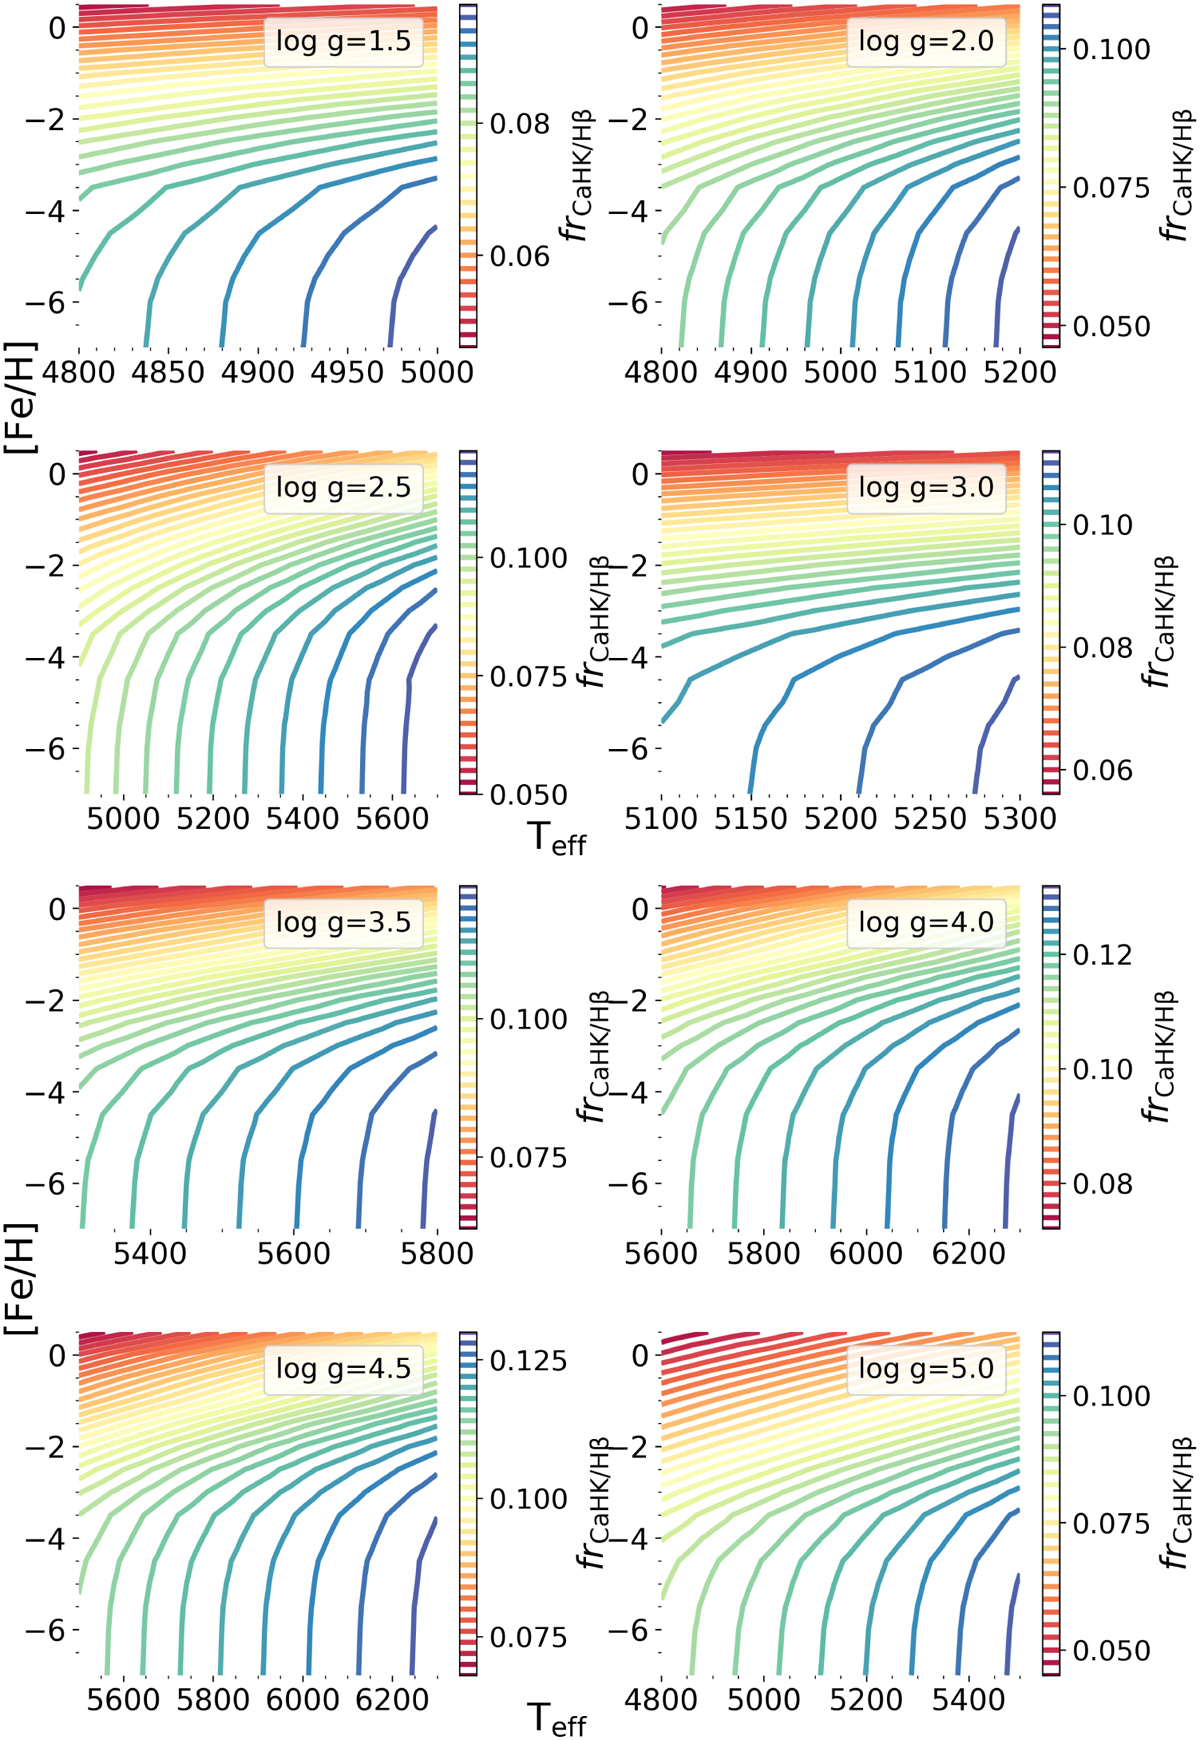
Contour plots where the third dimension are iso-flux lines, in particular for the frCaHK/Hβ flux ratio. Those iso-frCaHK/Hβ lines are temperature-sensitive up to about [Fe/H] = −3.5 dex, and then they become metallicity-sensitive, hence we can use them to find a relation from which we can infer [Fe/H]. Because the metallicity sensitivity starts at [Fe/H] = −3.5, we cannot distinguish iron abundances below that threshold, but rather identify whether they are below or above it.
Current usage metrics show cumulative count of Article Views (full-text article views including HTML views, PDF and ePub downloads, according to the available data) and Abstracts Views on Vision4Press platform.
Data correspond to usage on the plateform after 2015. The current usage metrics is available 48-96 hours after online publication and is updated daily on week days.
Initial download of the metrics may take a while.