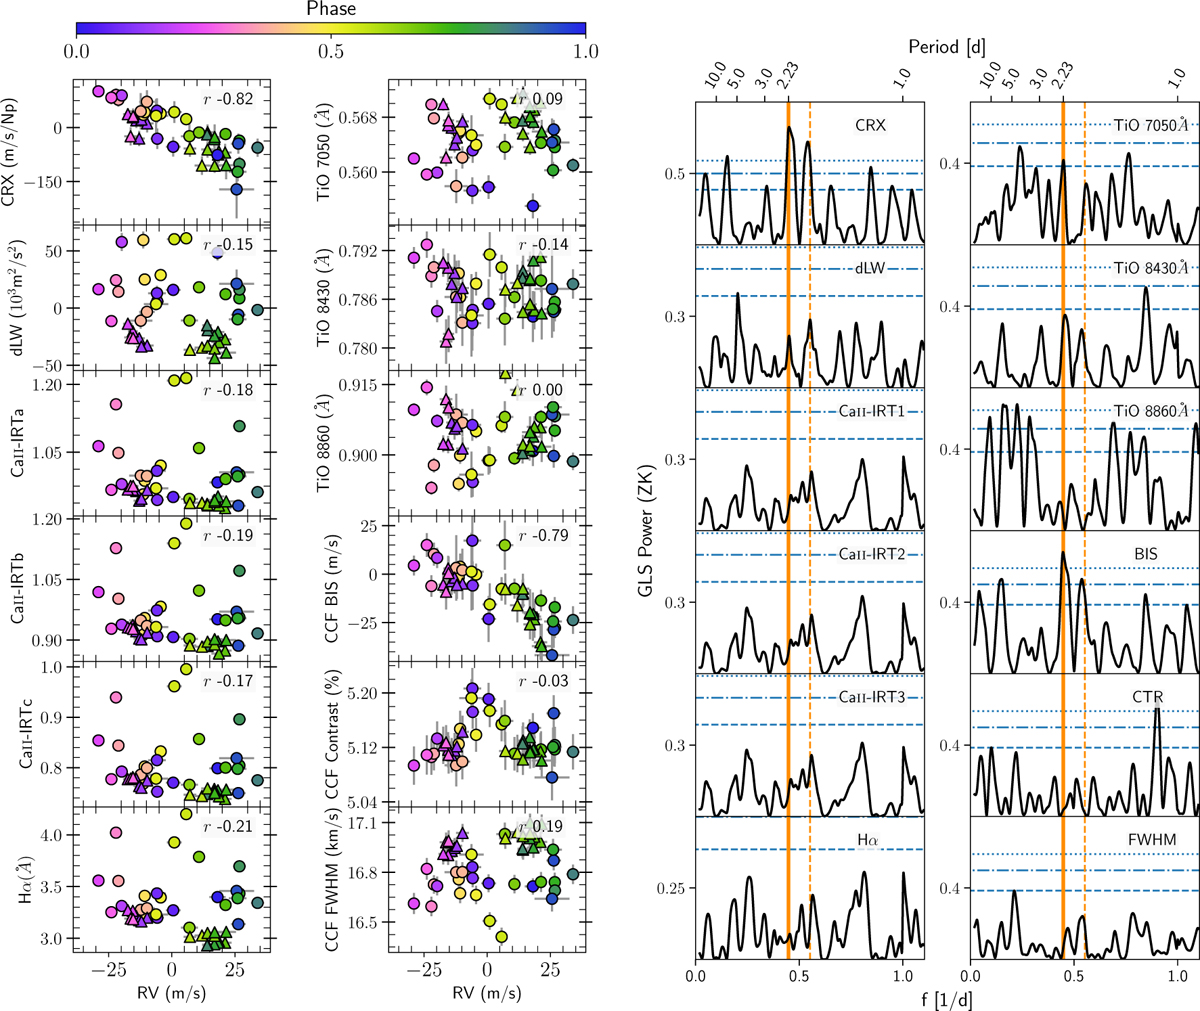
Fig. C.1
Download original image
Correlation plots with the RVs (left) and GLS periodograms (right) of the various stellar activity indicators from the CARMENES VIS spectroscopic data for AD Leo. For the correlation plots, the circles and triangles represent the first and second subset of CARMENES VIS data, respectively. Data points are color-coded with the rotation phase. The Pearson-r correlation coefficient combining both subsets is shown within each panel (R). For the periodograms, only the first season of the CARMENES VIS data was considered for plotting. The orange vertical solid and dashed lines represent the rotation period at P = 2.23 d and its daily alias at 1.81 d. The horizontal dotted, dot-dashed, and dashed blue lines represent the 10%, 1%, and 0.1% FAP levels.
Current usage metrics show cumulative count of Article Views (full-text article views including HTML views, PDF and ePub downloads, according to the available data) and Abstracts Views on Vision4Press platform.
Data correspond to usage on the plateform after 2015. The current usage metrics is available 48-96 hours after online publication and is updated daily on week days.
Initial download of the metrics may take a while.