Fig. 7
Download original image
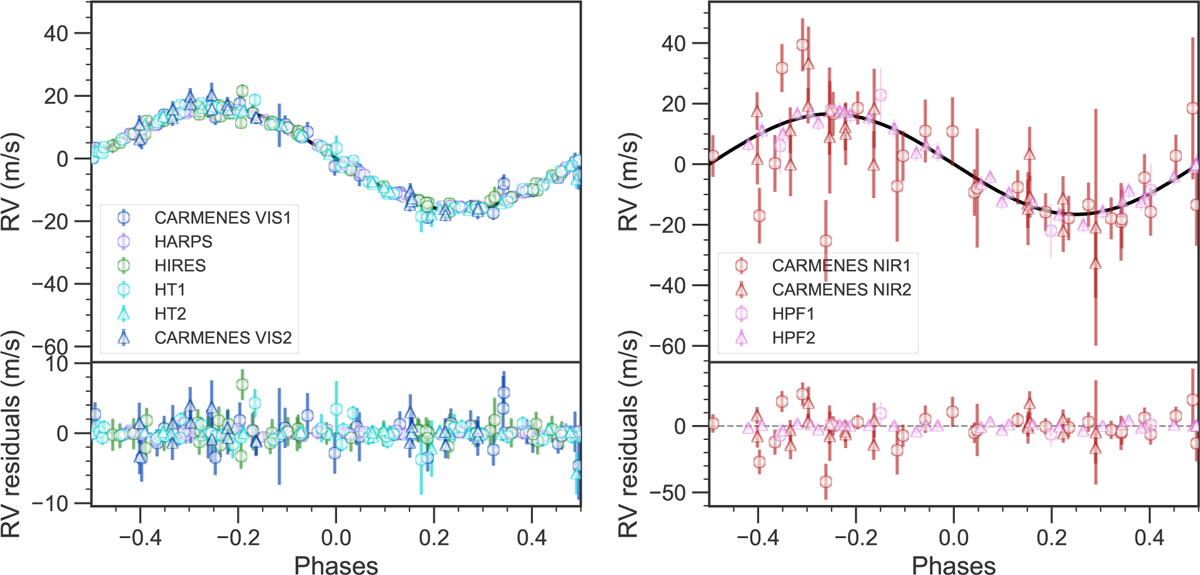
Phase-folded plots for the optical (left) and near-infrared (right) instruments using the circular Keplerian + dSHO-GP model after subtracting the GP component out. The first subset of any given instrument is represented with a circle, whereas the second subset by a triangle, when applicable. The y-axis ranges are consistent between the two plots, except for the residual plots to better visualize the scatter around the fit.
Current usage metrics show cumulative count of Article Views (full-text article views including HTML views, PDF and ePub downloads, according to the available data) and Abstracts Views on Vision4Press platform.
Data correspond to usage on the plateform after 2015. The current usage metrics is available 48-96 hours after online publication and is updated daily on week days.
Initial download of the metrics may take a while.