Fig. 6
Download original image
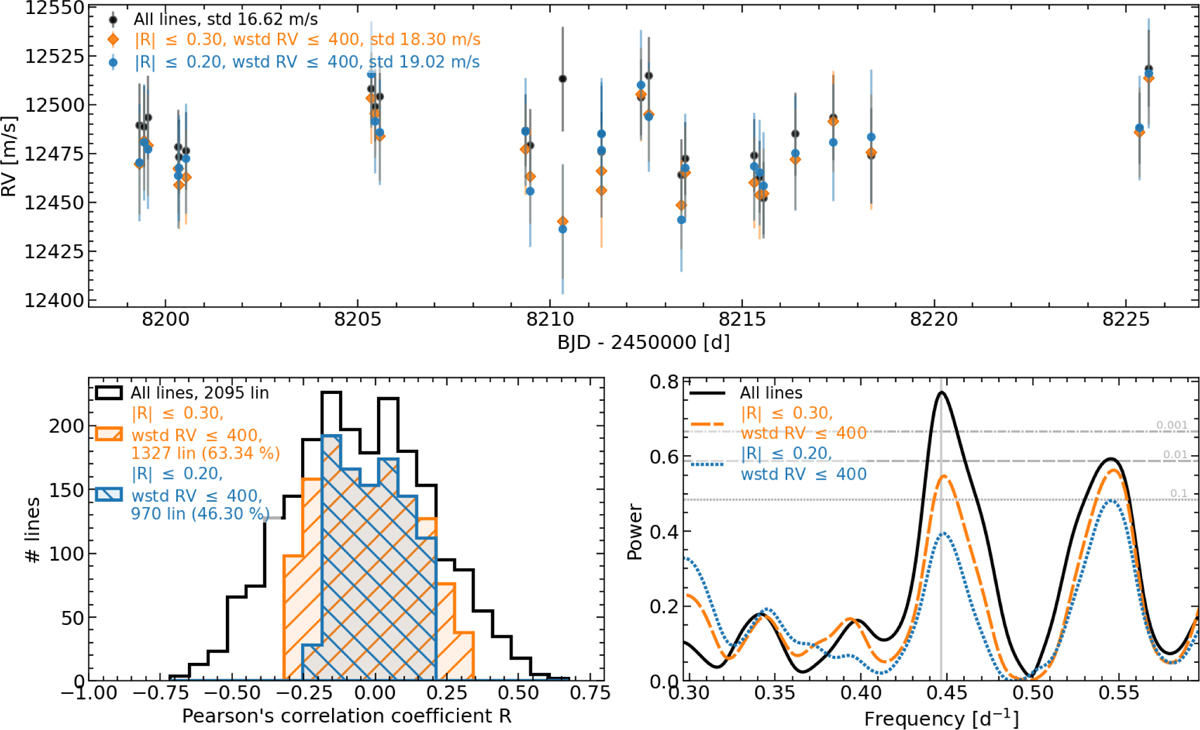
Three various subsamples of the spectral lines: black – all, orange – |r| ≤ 0.30, and blue – |r| ≤ 0.20. Top: absolute RVs versus time for the first CARMENES VIS season. Bottom left: histogram of the Pearson-r correlation coefficient when comparing the RVs from individual lines to the CRX. The criteria for the subsamples are illustrated here. Bottom right: zoomed-in GLS periodograms around the signal of interest of the RVs of the subsamples. The orange subsample still shows power at 2.23 days, whereas the blue subsample still has a nonsignificant bump but it is noise limited.
Current usage metrics show cumulative count of Article Views (full-text article views including HTML views, PDF and ePub downloads, according to the available data) and Abstracts Views on Vision4Press platform.
Data correspond to usage on the plateform after 2015. The current usage metrics is available 48-96 hours after online publication and is updated daily on week days.
Initial download of the metrics may take a while.