Fig. 5
Download original image
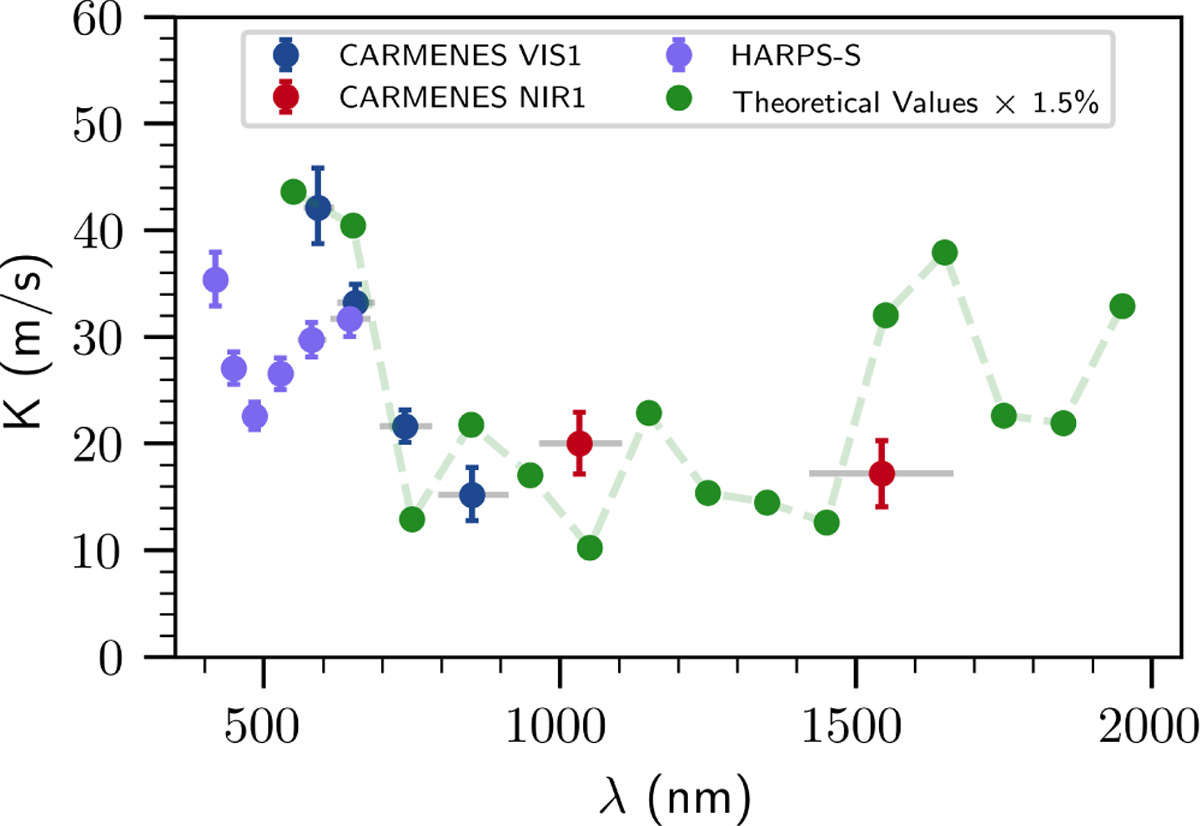
Radial-velocity semi-amplitudes as a function of wavelength for the wavelength chunks from HARPS and the CARMENES VIS and NIR spectographs. The gray horizontal lines for each data point correspond to the wavelength coverage considered when recomputing the RV for the wavelength chunk. The green dots connected by a dashed line represent the theoretical values of a 1.5% spot coverage on a 3700 K, v sin i of 5 km s−1 star with a temperature difference of 200 K taken from Reiners et al. (2010). The theoretical values are binned in 2 to serve as a better comparison to the wavelength bins provided by the real data.
Current usage metrics show cumulative count of Article Views (full-text article views including HTML views, PDF and ePub downloads, according to the available data) and Abstracts Views on Vision4Press platform.
Data correspond to usage on the plateform after 2015. The current usage metrics is available 48-96 hours after online publication and is updated daily on week days.
Initial download of the metrics may take a while.