Fig. 4

Download original image
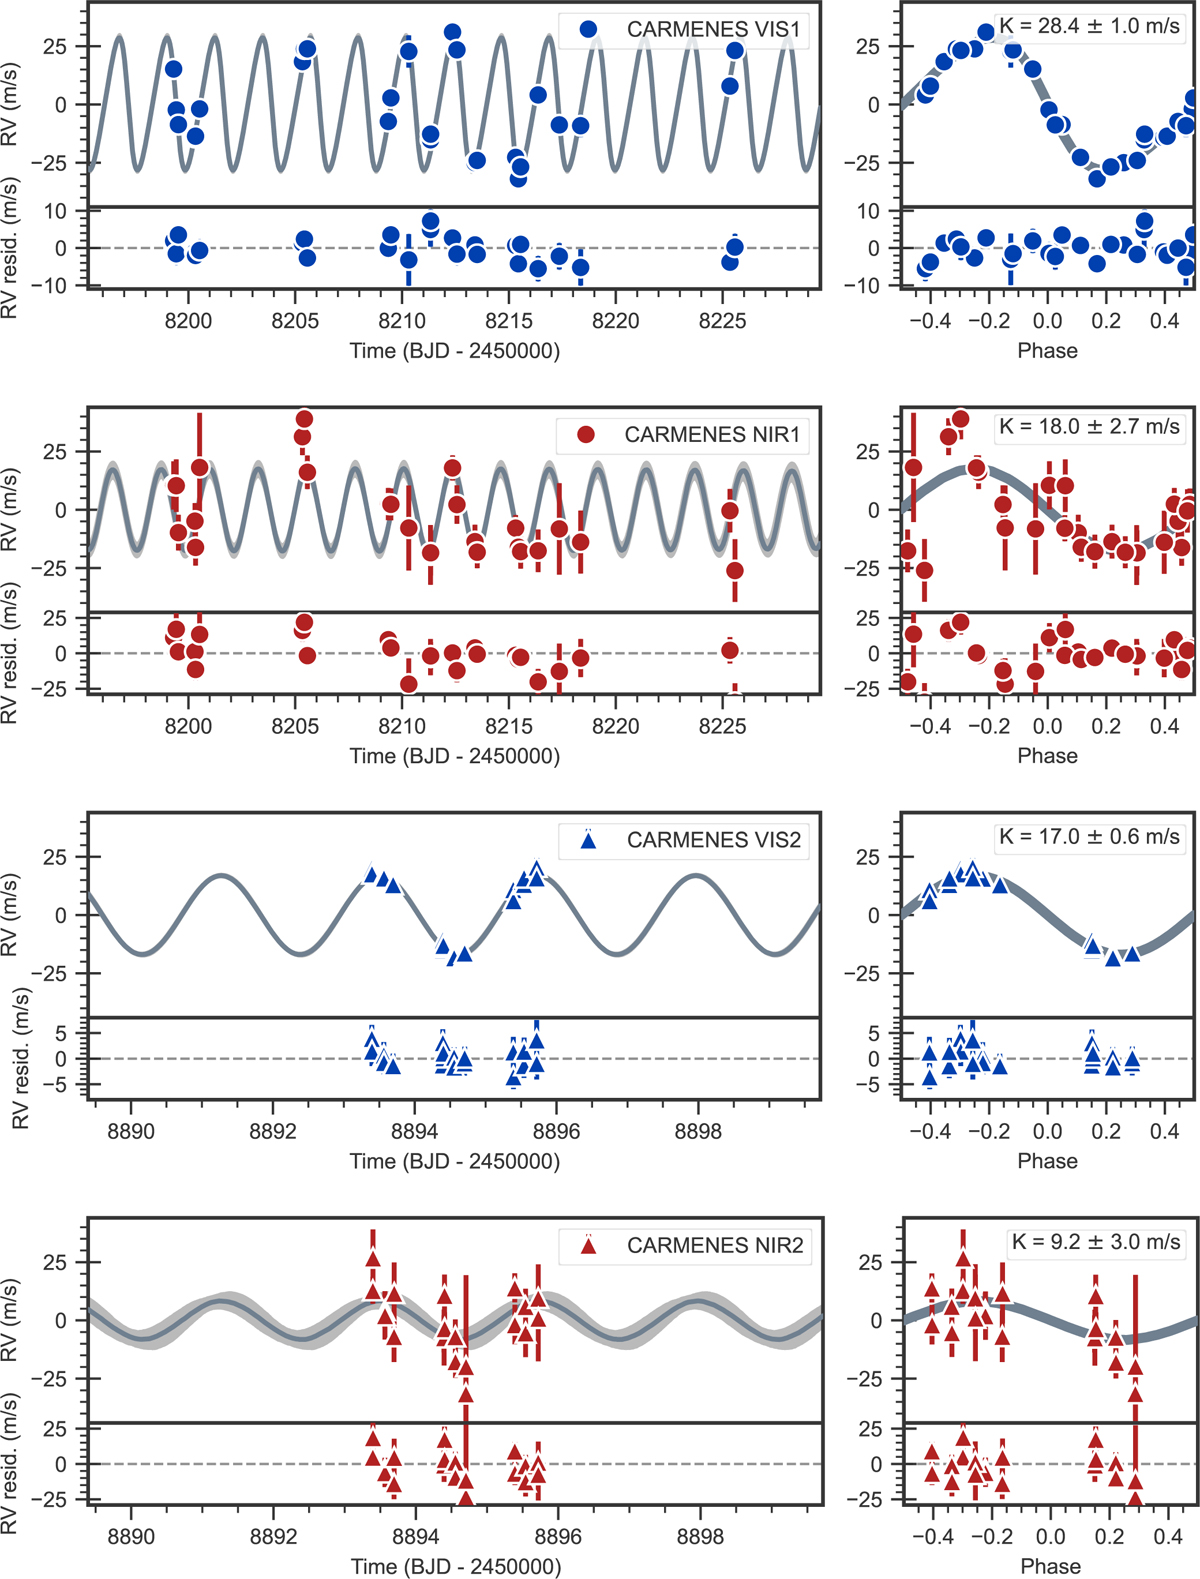
Radial-velocity times series and phase-folded plots for the CARMENES VIS1, NIR1, VIS2, and NIR2 data (top to bottom) with residuals from the best-fit model. In some cases, especially in the panels with the VIS1 and VIS2 data, the uncertainties are too small to be seen in the plots. The best-fit models are overplotted (gray line) along with the 68% posterior bands (gray shaded regions).
Current usage metrics show cumulative count of Article Views (full-text article views including HTML views, PDF and ePub downloads, according to the available data) and Abstracts Views on Vision4Press platform.
Data correspond to usage on the plateform after 2015. The current usage metrics is available 48-96 hours after online publication and is updated daily on week days.
Initial download of the metrics may take a while.


