Fig. 3
Download original image
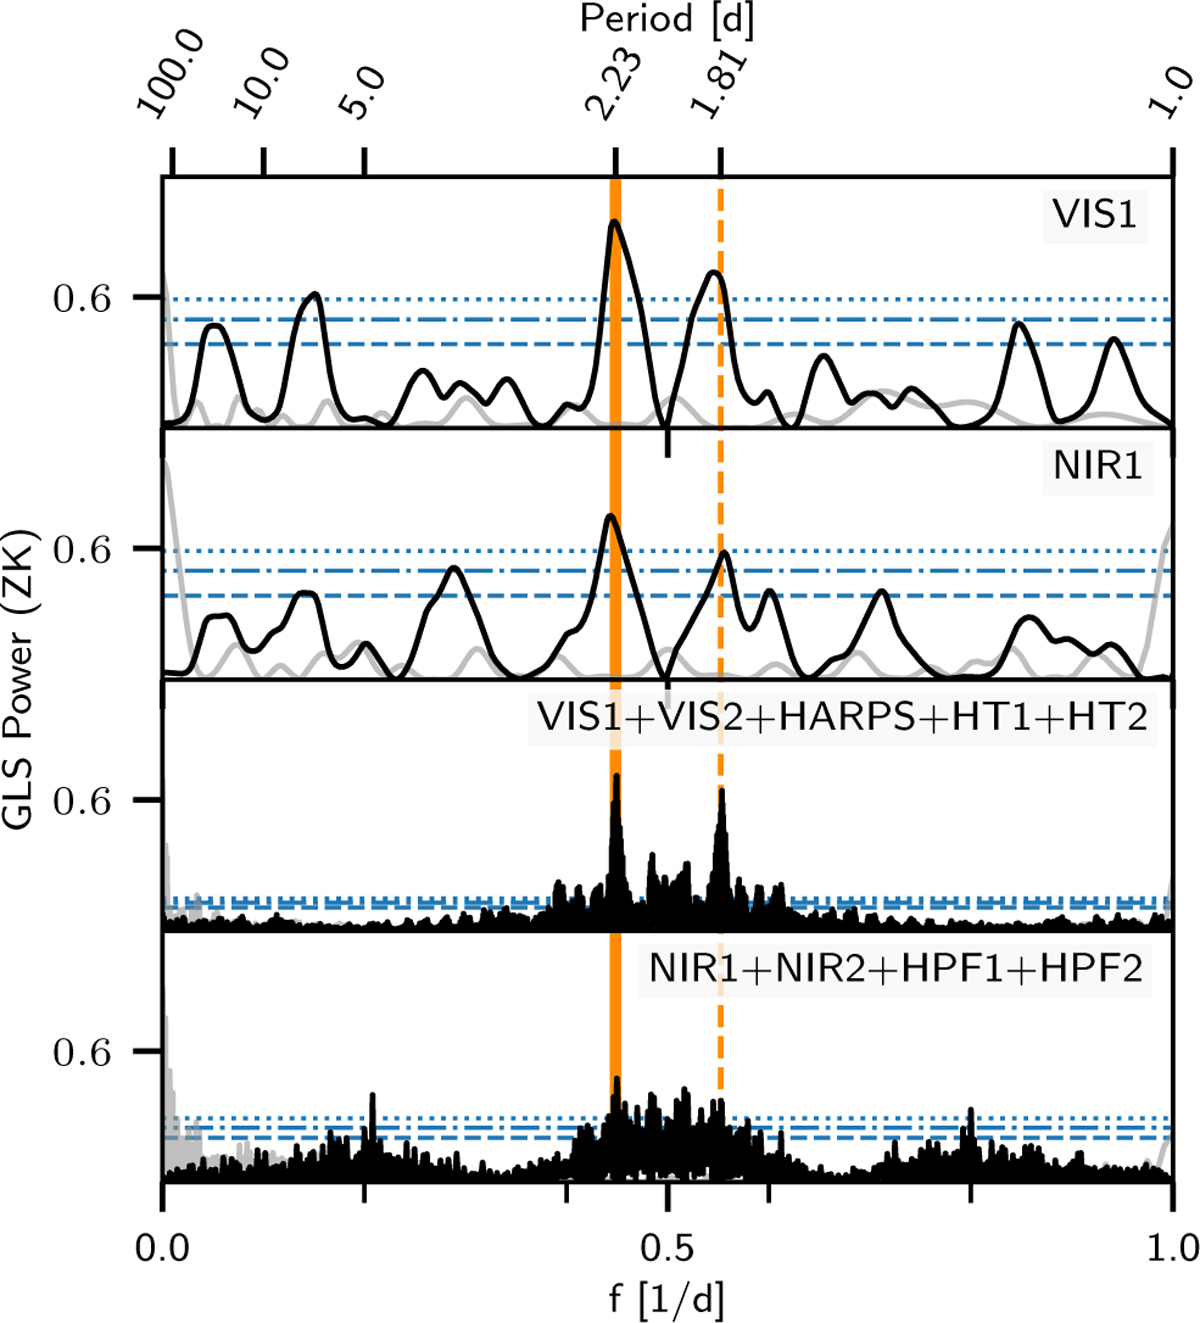
GLS periodograms (black) and window functions (gray) for the CARMENES VIS1 and NIR1 RV data sets, as well as for the combined optical (i.e., VIS1, VIS2, HARPS, HT1, and HT2) and near-infrared (i.e., NIR1, NIR2, HPF1, HPF2) instruments, with offsets accounted for. The horizontal lines correspond to FAP levels of 10% (dashed), 1% (dash-dotted), and 0.1% (dotted). These are computed by using the randomization technique for 10 000 samples. The orange solid line corresponds to the rotational period of 2.23 days, whereas the orange dashed line represents the 1.81 d alias signal due to daily sampling.
Current usage metrics show cumulative count of Article Views (full-text article views including HTML views, PDF and ePub downloads, according to the available data) and Abstracts Views on Vision4Press platform.
Data correspond to usage on the plateform after 2015. The current usage metrics is available 48-96 hours after online publication and is updated daily on week days.
Initial download of the metrics may take a while.