Fig. 2
Download original image
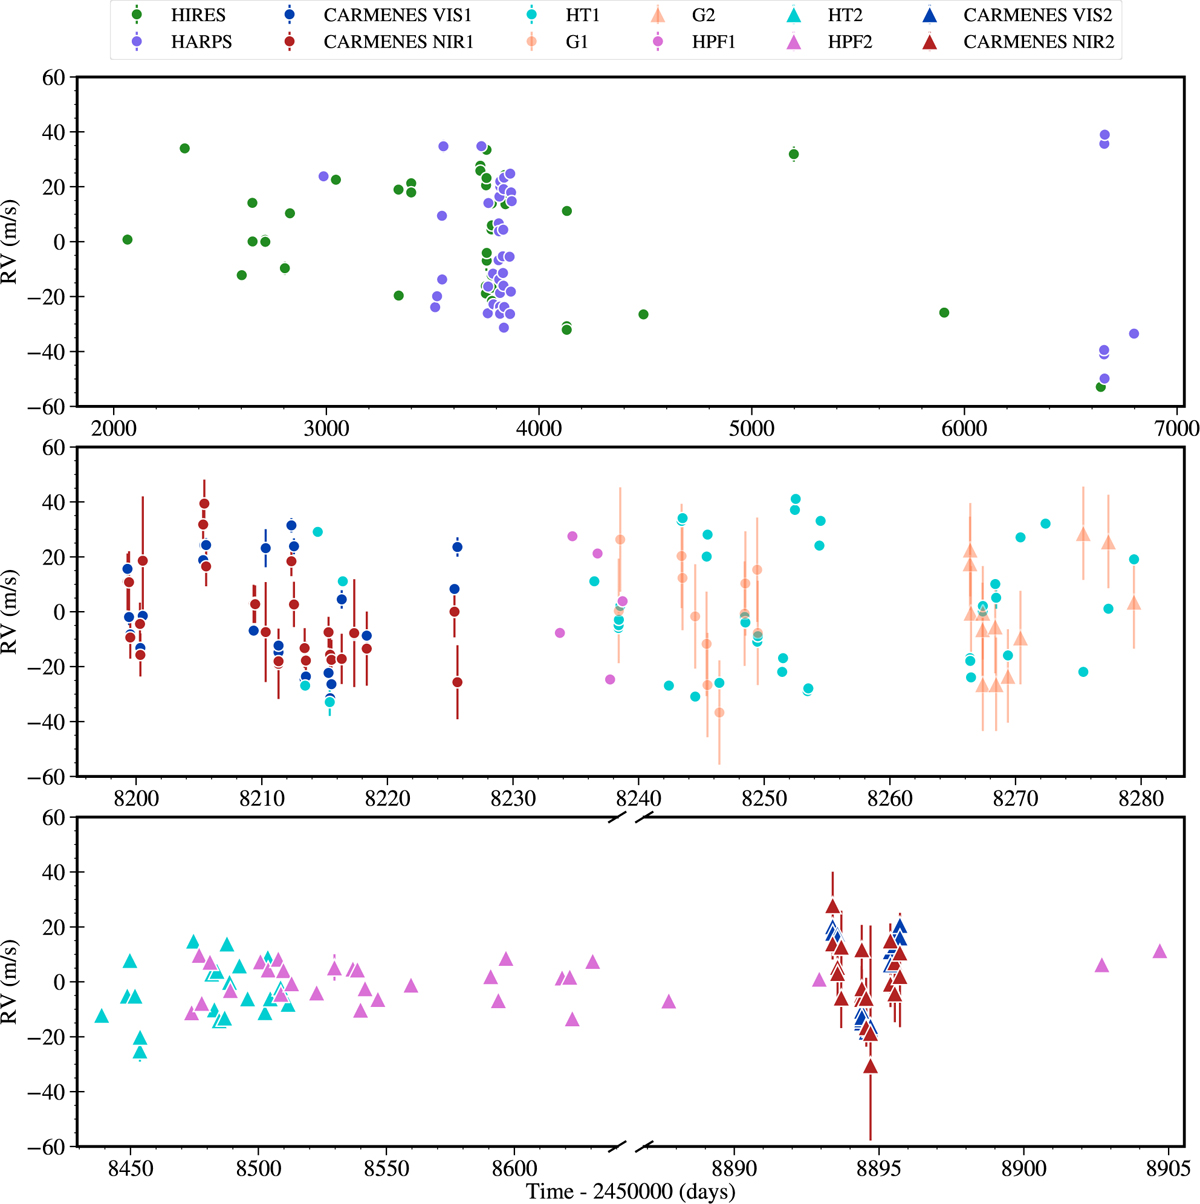
Time series of all RVs with instrumental offsets accounted for. The RV uncertainties are included, though many are too small to be seen in the plots. The HIRES and HARPS data span a large time range and the rest of the data come in ~12yr later after the time when the majority of the previous data were taken. The time axis is interrupted in several places, and stretched differently between the individual sections. Additionally, the majority of HIRES and HARPS time series are overlapping each other. Four of the HARPS-N data overlap with CARMENES data; and the GIANO-B data are taken all within the first observing run for HARPS-N. The first season of HPF data overlaps with the HARPS-N and GIANO-B data sets whereas the HPF second season overlaps with the HARPS-N and CARMENES second season.
Current usage metrics show cumulative count of Article Views (full-text article views including HTML views, PDF and ePub downloads, according to the available data) and Abstracts Views on Vision4Press platform.
Data correspond to usage on the plateform after 2015. The current usage metrics is available 48-96 hours after online publication and is updated daily on week days.
Initial download of the metrics may take a while.