Fig. 7
Download original image
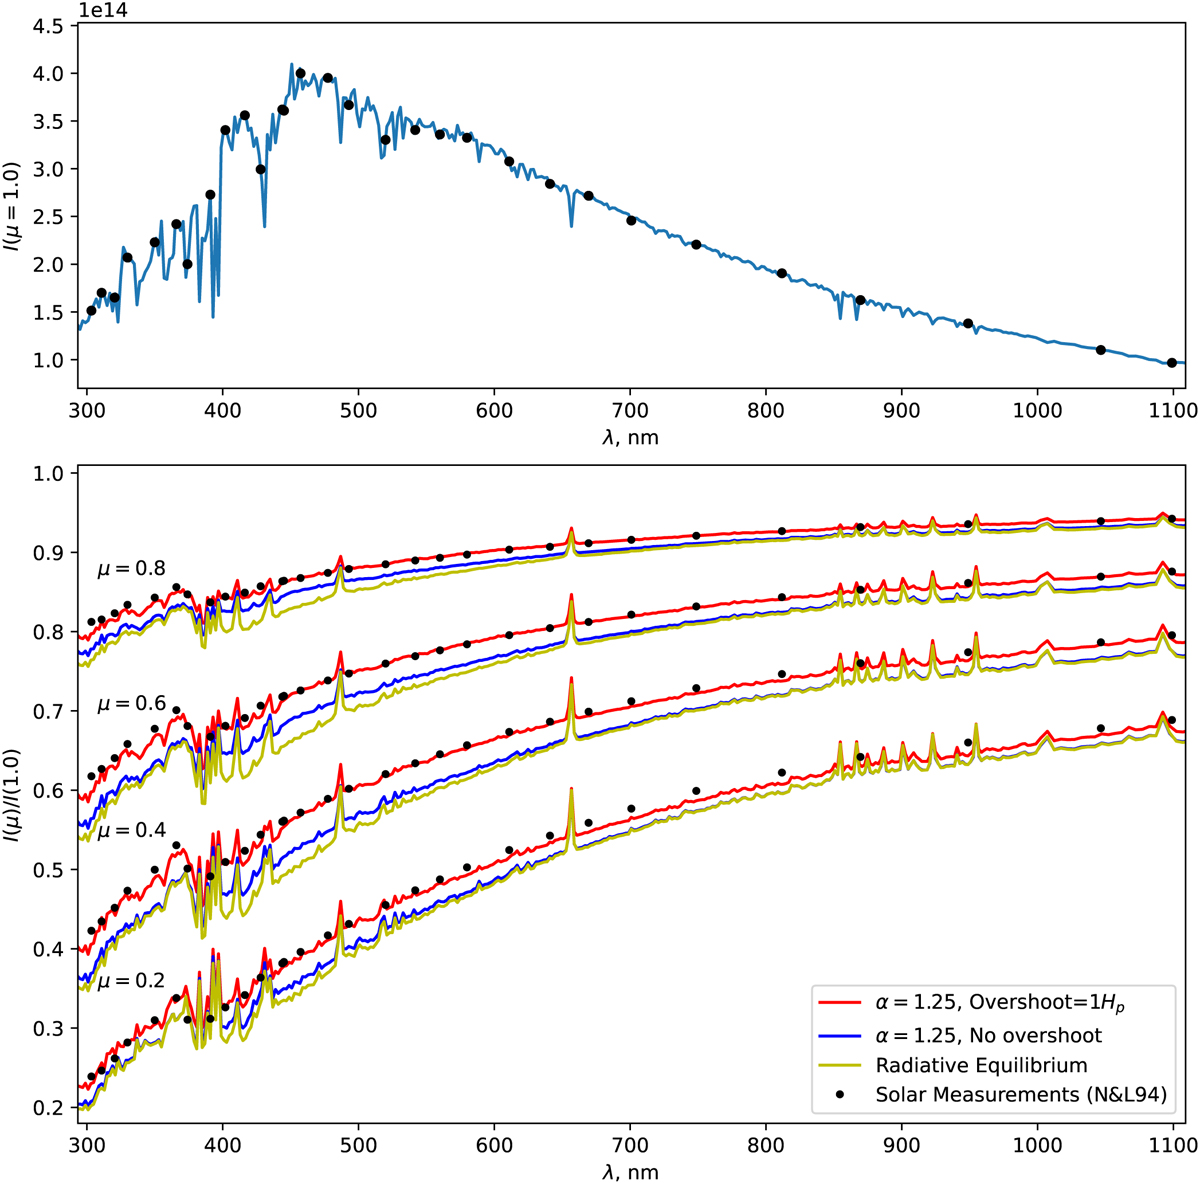
Solar spectrum (top panel) and a comparison of solar limb-darkening computations with solar measurements by Neckel & Labs (1994) (bottom panel). Stars in both panels depict the solar measurements, and lines represent computations. Measurements and computations of solar spectrum in the top panel are shown at the disk center. Spectra at selected view angles, namely the µ = 0.8, 0.6, 0.4, and 0.2, normalized to the solar spectrum at the disk center, are shown in the bottom panel. The different line types marked in the legend to the figure correspond to the computation with different approximations: RE, with convection (α = 1.25), and with convection and overshoots. Intensity is measured in [erg cm−3 s−1 sr−1].
Current usage metrics show cumulative count of Article Views (full-text article views including HTML views, PDF and ePub downloads, according to the available data) and Abstracts Views on Vision4Press platform.
Data correspond to usage on the plateform after 2015. The current usage metrics is available 48-96 hours after online publication and is updated daily on week days.
Initial download of the metrics may take a while.