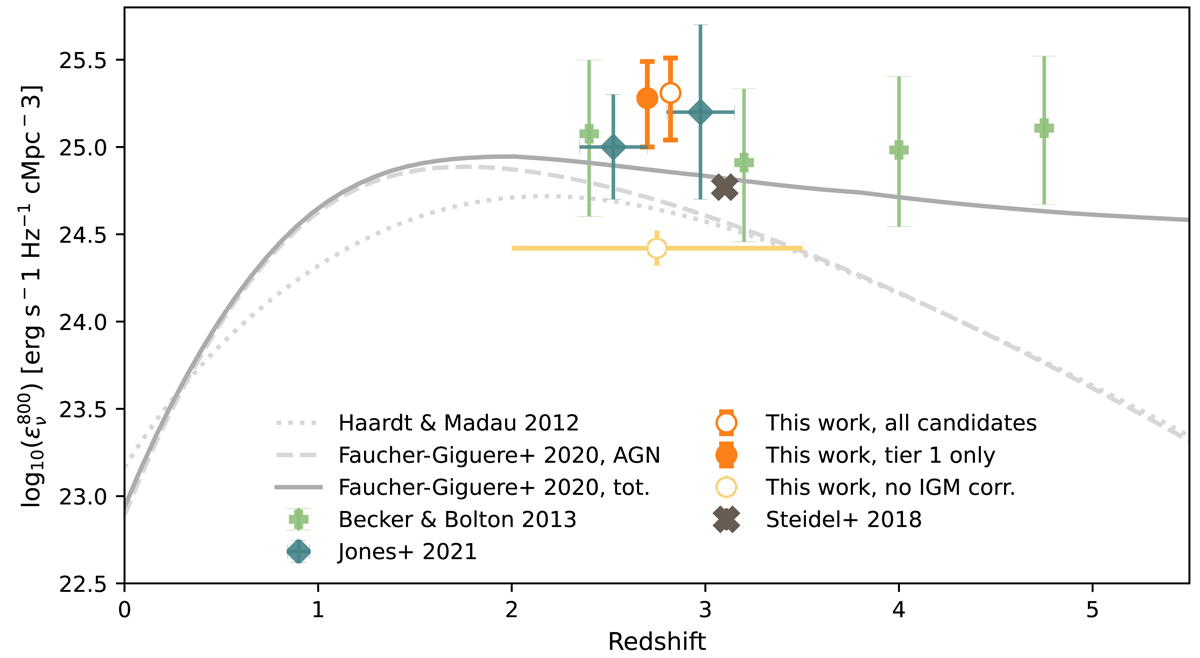
Fig. 8.
Download original image
Ionizing volume emissivity derived from the galaxies of this work compared to other measurements and predictions in the literature. Gray dashed and dotted lines show the theoretical models for bright AGN by Faucher-Giguère (2020) and Haardt & Madau (2012), and the fully drawn line shows the combined model of AGN and star formation from Faucher-Giguère (2020). Light green plus signs show the ionizing field in various redshift bins measured from the IGM properties by Becker & Bolton (2013). Dark green diamonds show the emissivity from star formation measured by Jones et al. (2021), and the single dark cross shows the estimate from Steidel et al. (2018). The filled orange marker shows the value derived from only the four tier one candidates in this work, while the open orange marker shows the value derived assuming that all the candidates are bona fide leakers. The open yellow marker shows the same as the open orange marker, but not corrected for IGM absorption. The orange and yellow markers are showed a bit offset on the redshift axis for visibility, but all are measured in one single redshift bin of 2 < z < 3.5 (illustrated with the horizontal yellow bar), with an average redshift of 2.81.
Current usage metrics show cumulative count of Article Views (full-text article views including HTML views, PDF and ePub downloads, according to the available data) and Abstracts Views on Vision4Press platform.
Data correspond to usage on the plateform after 2015. The current usage metrics is available 48-96 hours after online publication and is updated daily on week days.
Initial download of the metrics may take a while.