Fig. 5.
Download original image
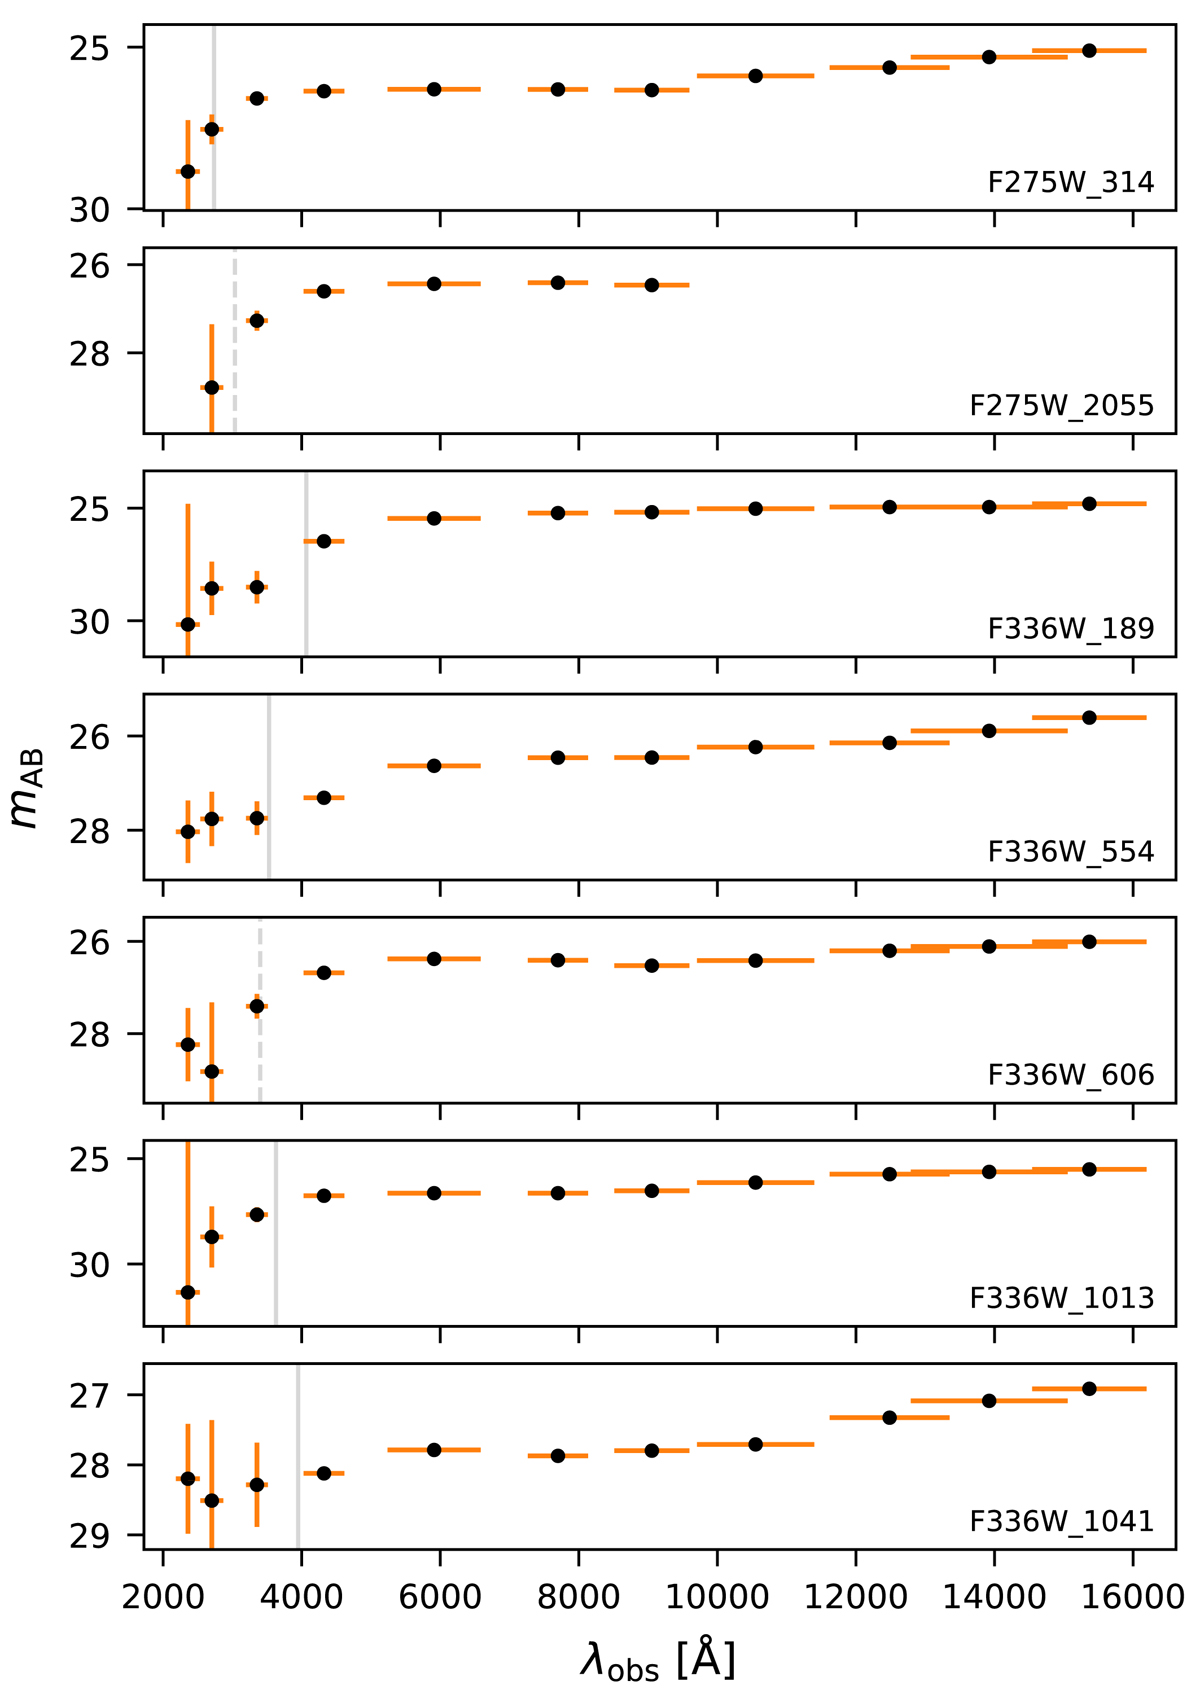
Spectral energy distributions of the leaker candidates, extracted in circular apertures of radius ![]() . The dotted vertical lines mark the Lyman Edge at the redshifts listed in Table 4. We note that errors in the UV bands are inflated for the reasons described in Sects. 3.4 and 4.1. Some datapoints here are shown as such despite being consistent with zero shows a comparison of uncertainties in segments and fixed apertures.
. The dotted vertical lines mark the Lyman Edge at the redshifts listed in Table 4. We note that errors in the UV bands are inflated for the reasons described in Sects. 3.4 and 4.1. Some datapoints here are shown as such despite being consistent with zero shows a comparison of uncertainties in segments and fixed apertures.
Current usage metrics show cumulative count of Article Views (full-text article views including HTML views, PDF and ePub downloads, according to the available data) and Abstracts Views on Vision4Press platform.
Data correspond to usage on the plateform after 2015. The current usage metrics is available 48-96 hours after online publication and is updated daily on week days.
Initial download of the metrics may take a while.