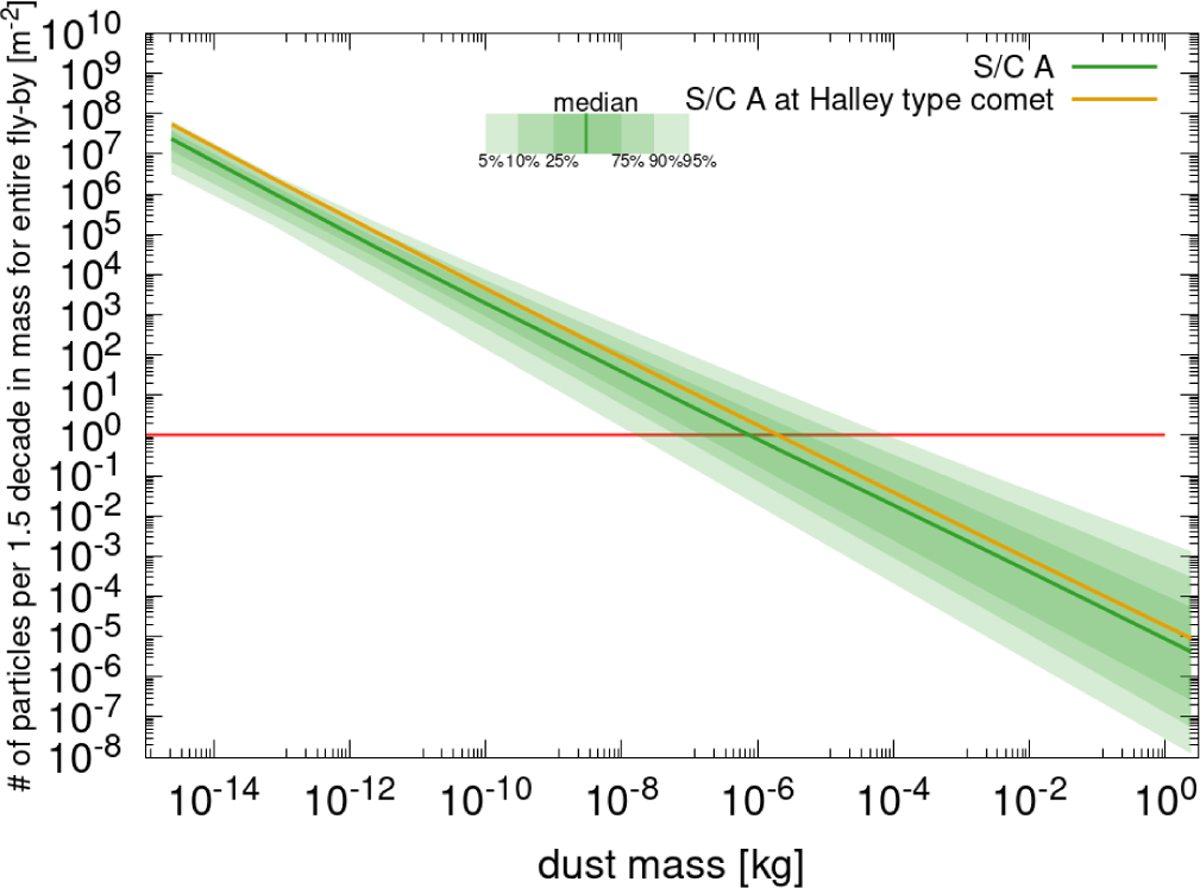
Fig. 7
Download original image
Total number of dust particles encountered according to the EDCM along the spacecraft trajectory of spacecraft A as function dust mass. The shaded areas show different percentile ranges within which cases fall. Additionally the orange curve shows the predicted median densities for a Halley type comet (according to the definition in Sect. 3).
Current usage metrics show cumulative count of Article Views (full-text article views including HTML views, PDF and ePub downloads, according to the available data) and Abstracts Views on Vision4Press platform.
Data correspond to usage on the plateform after 2015. The current usage metrics is available 48-96 hours after online publication and is updated daily on week days.
Initial download of the metrics may take a while.