Fig. 12
Download original image
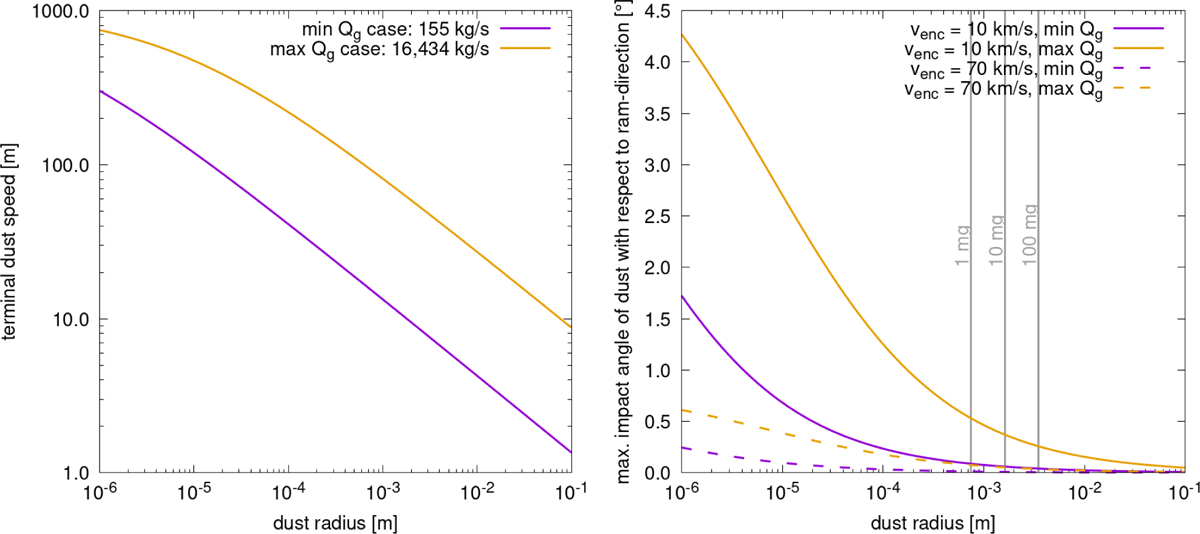
Dust speed and impact angles for different dust sizes and activity levels. Left panel: terminal dust speed, υd,term, according to Eq. (15) for two gas cases. The lowest gas production rate case considered in the EDCM in purple (min Qg case, where RN = 2 km and Qg = 155 kg s−1) and the highest gas production rate case in orange (max Qg case, where RN = 5 km and Qg = 16 434 kg s−1). Right panel: maximum angle of impact of dust particles with respect to the ram-direction of the spacecraft. The solid lines are for a fly-by speed of 10 km s−1 and the dashed lines for 70 km s−1. The colours are the min. and max. gas production cases as in the left panel. The corresponding radii of particles with masses 1 mg, 10 mg, and 100 mg are indicated by the grey lines.
Current usage metrics show cumulative count of Article Views (full-text article views including HTML views, PDF and ePub downloads, according to the available data) and Abstracts Views on Vision4Press platform.
Data correspond to usage on the plateform after 2015. The current usage metrics is available 48-96 hours after online publication and is updated daily on week days.
Initial download of the metrics may take a while.