Open Access
Fig. 7
Download original image
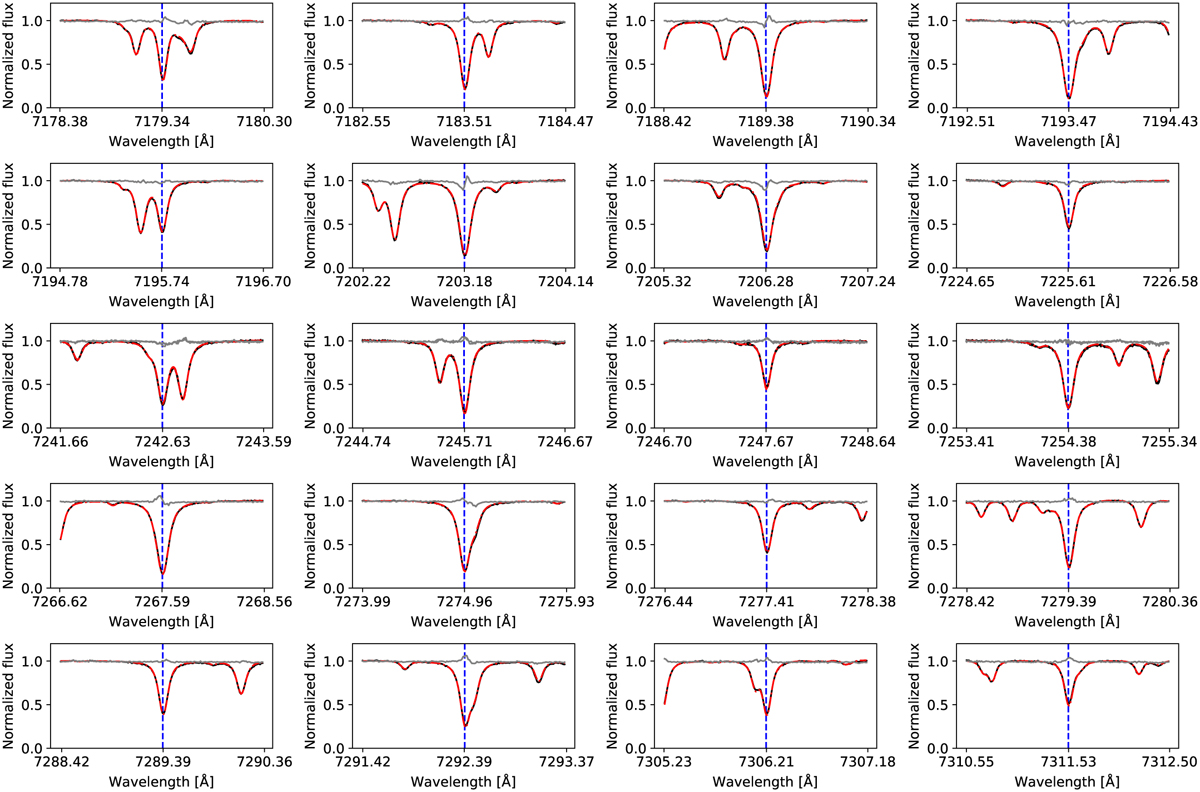
Stellar spectrum of HR 1544 before (black) and after (gray) telluric correction around the subset of the 20 selected lines. Each panel is for a different line, with its position indicated by the vertical dashed blue line. The telluric spectrum is shown as the dashed red curve.
Current usage metrics show cumulative count of Article Views (full-text article views including HTML views, PDF and ePub downloads, according to the available data) and Abstracts Views on Vision4Press platform.
Data correspond to usage on the plateform after 2015. The current usage metrics is available 48-96 hours after online publication and is updated daily on week days.
Initial download of the metrics may take a while.