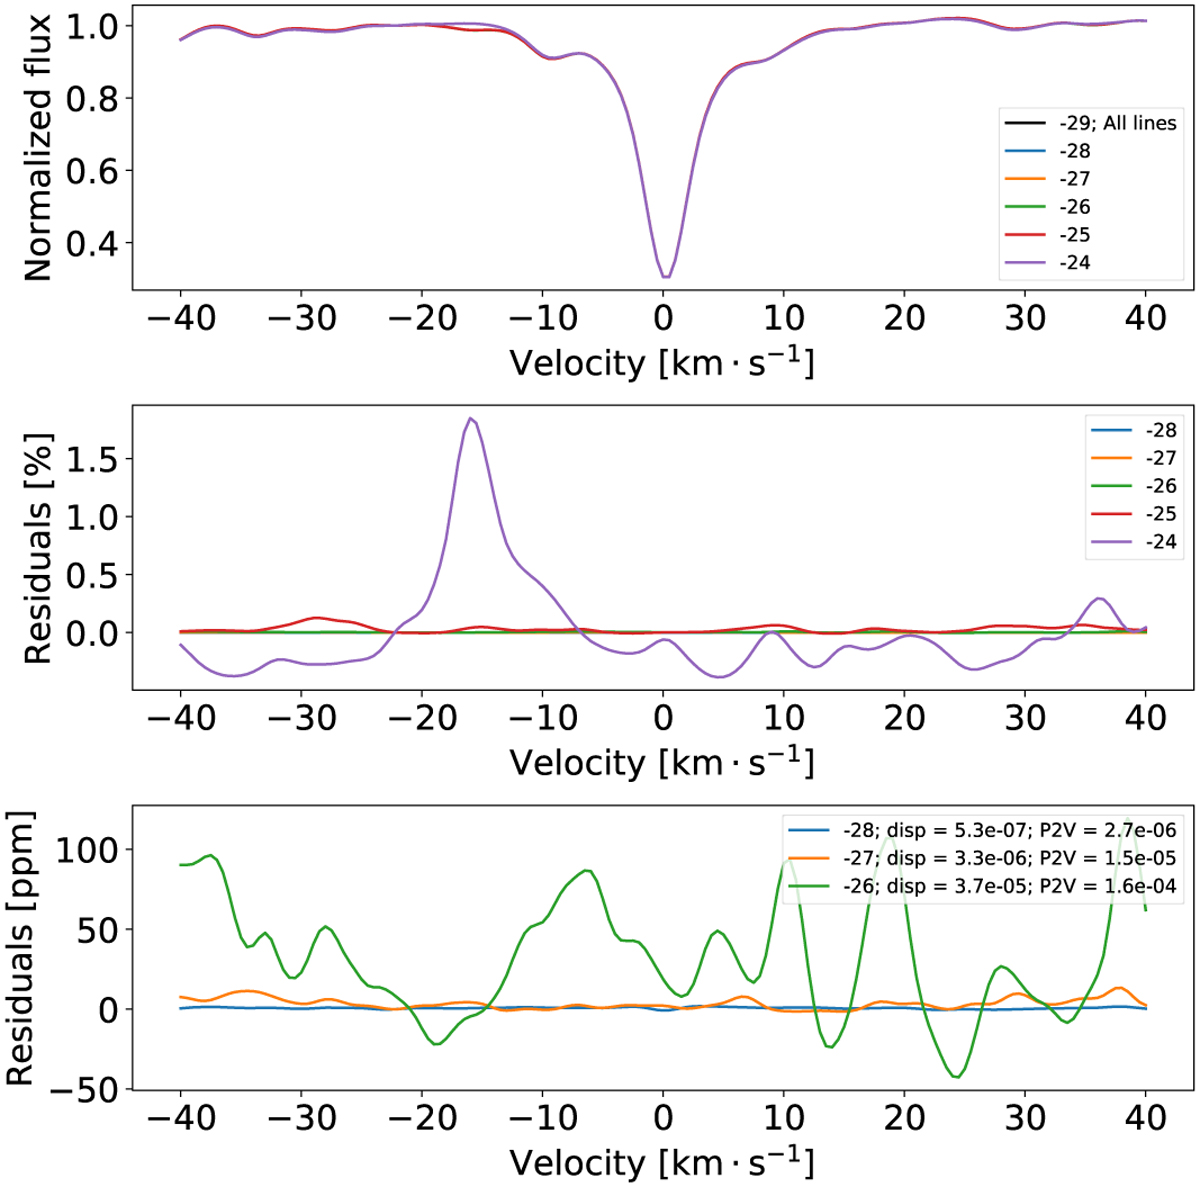
Fig. 3
Download original image
Impact of the number of lines selected in the telluric model. Top panel: average water telluric line built for the model, with line intensity thresholds at 10−24, 10−25, 10−26, 10−27, 10−28, and 10−29 cm−1/(molecule cm−2). Middle panel: residuals of the average lines with respect to including all the lines. See Sect. 3 for more details on how the average line is built. Bottom panel: zoom on the residuals obtained with the model that includes the 10−26, 10−27, 10−28 cm−1/(molecule cm−2) strongest water lines. The dispersion and P2V amplitude of the residuals are reported in the legend.
Current usage metrics show cumulative count of Article Views (full-text article views including HTML views, PDF and ePub downloads, according to the available data) and Abstracts Views on Vision4Press platform.
Data correspond to usage on the plateform after 2015. The current usage metrics is available 48-96 hours after online publication and is updated daily on week days.
Initial download of the metrics may take a while.