Open Access
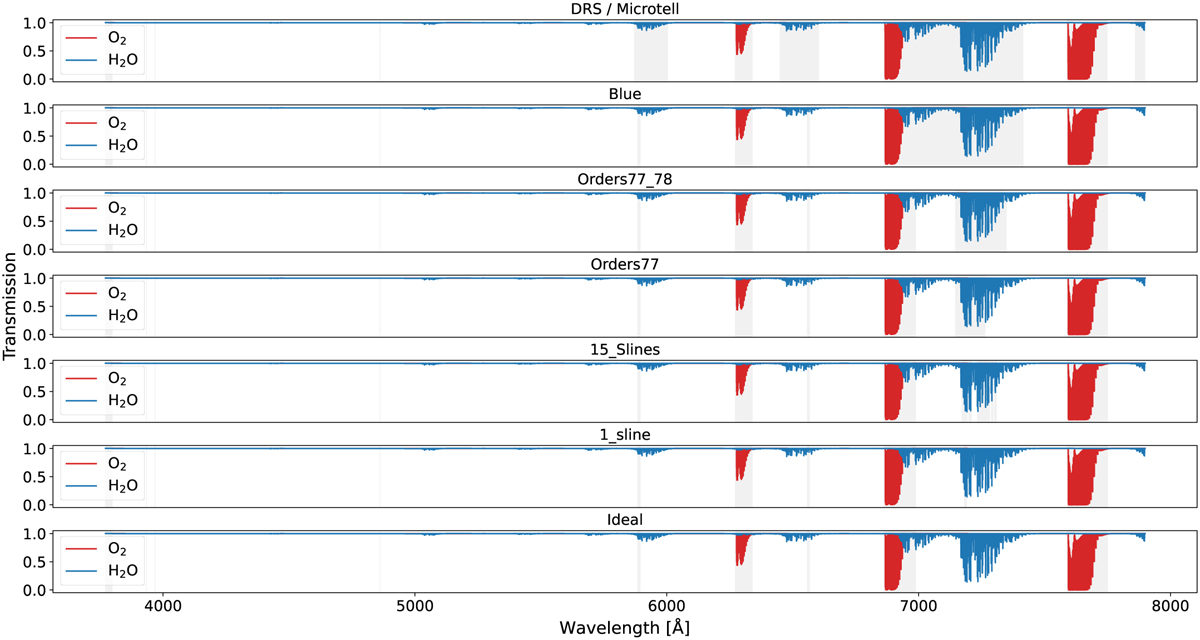
Fig. C.1
Download original image
Telluric spectrum in the range of ESPRESSO. In blue, the H2O lines, and in red the O2 lines. The different masks are shown in the panels and are ordered as a function of the spectral coverage included in the mask. In gray are the regions excluded from the mask.
Current usage metrics show cumulative count of Article Views (full-text article views including HTML views, PDF and ePub downloads, according to the available data) and Abstracts Views on Vision4Press platform.
Data correspond to usage on the plateform after 2015. The current usage metrics is available 48-96 hours after online publication and is updated daily on week days.
Initial download of the metrics may take a while.