Open Access
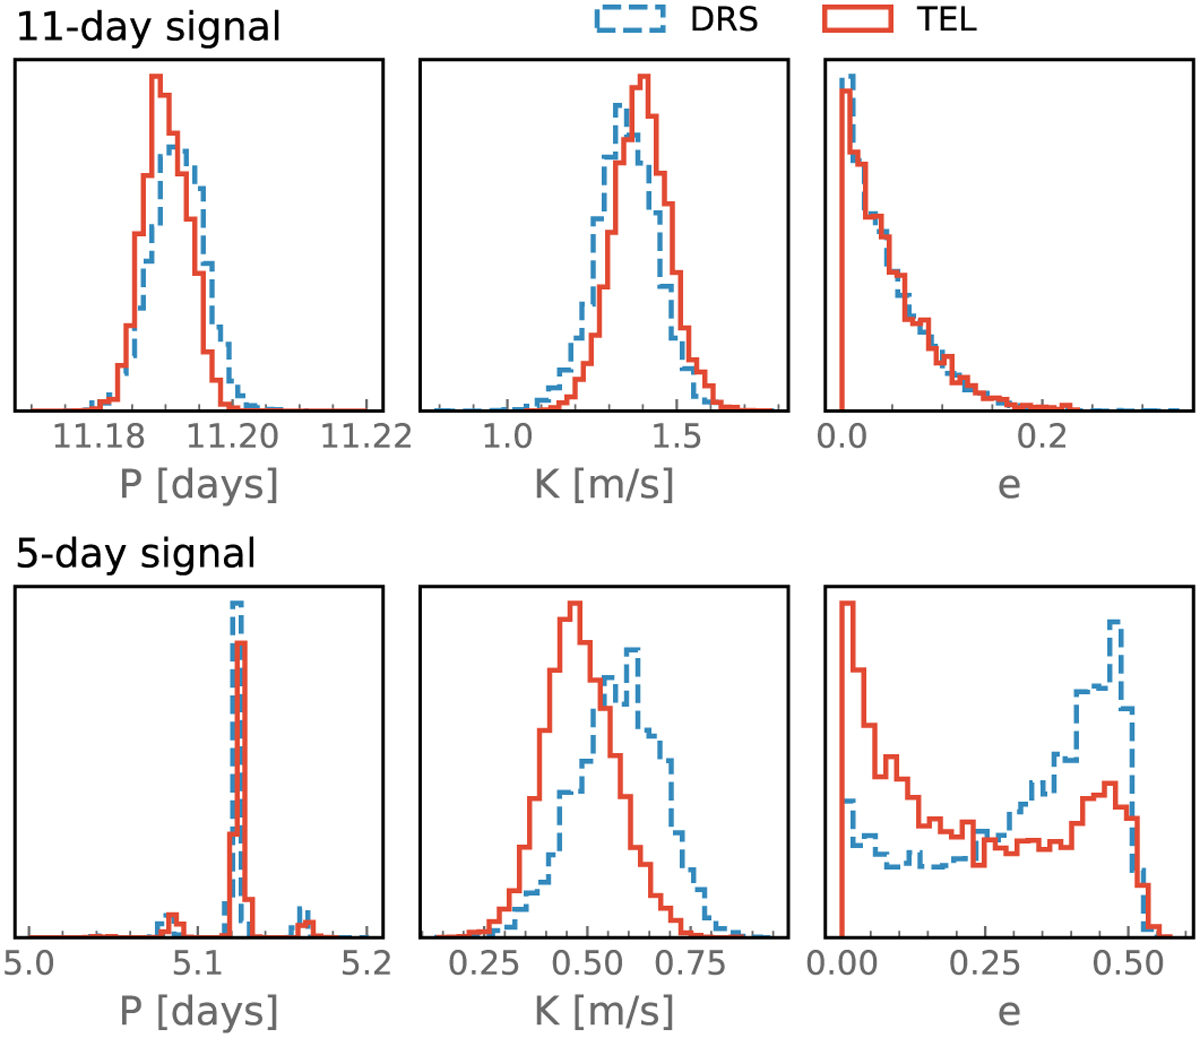
Fig. 15
Download original image
Posterior distributions for the orbital period, semi-amplitude, and eccentricity of the 11-day (top) and 5-day (bottom) signals. The dashed blue histograms correspond to the analysis of the DRS RVs, while the red histograms correspond to the analysis of the telluric-corrected RVs (TEL).
Current usage metrics show cumulative count of Article Views (full-text article views including HTML views, PDF and ePub downloads, according to the available data) and Abstracts Views on Vision4Press platform.
Data correspond to usage on the plateform after 2015. The current usage metrics is available 48-96 hours after online publication and is updated daily on week days.
Initial download of the metrics may take a while.