Fig. 1
Download original image
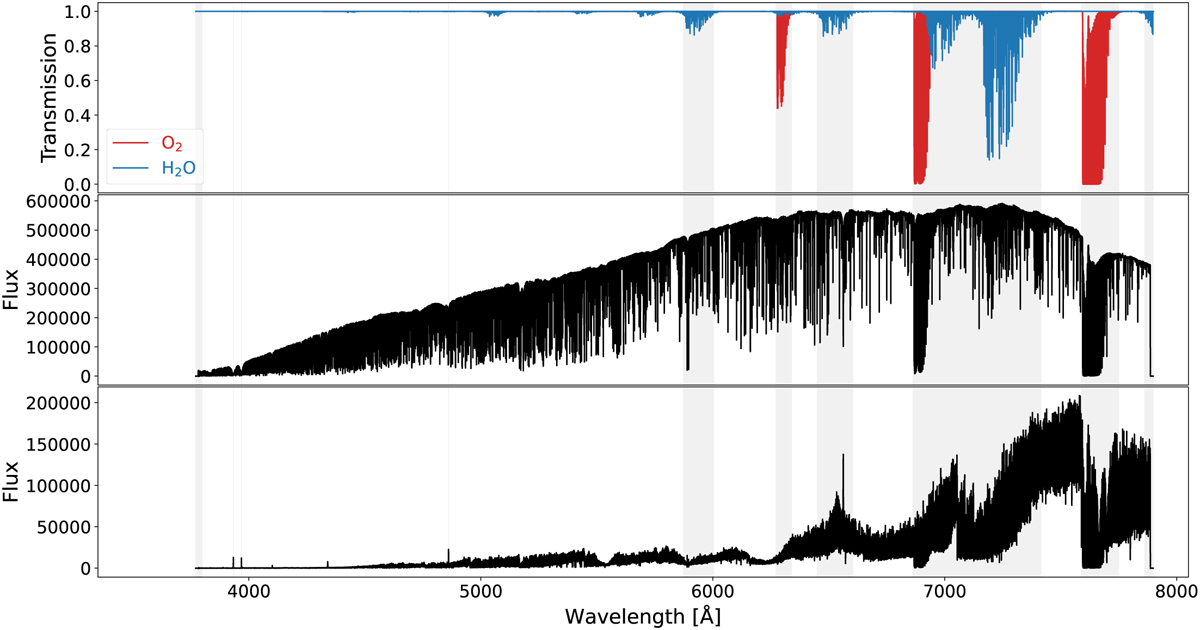
Telluric and stellar spectra over the ESPRESSO spectral range. The gray bands are the regions excluded from the mask used in the ESPRESSO DRS. Top panel: telluric spectrum produced with Molecfit (Smette et al. 2015; Kausch et al. 2015). The H2O lines are in blue, while the O2 lines are in red. Middle panel: ESPRESSO spectrum of the G-type star Tau Ceti. Bottom panel: ESPRESSO spectrum of the M5-type star Proxima.
Current usage metrics show cumulative count of Article Views (full-text article views including HTML views, PDF and ePub downloads, according to the available data) and Abstracts Views on Vision4Press platform.
Data correspond to usage on the plateform after 2015. The current usage metrics is available 48-96 hours after online publication and is updated daily on week days.
Initial download of the metrics may take a while.