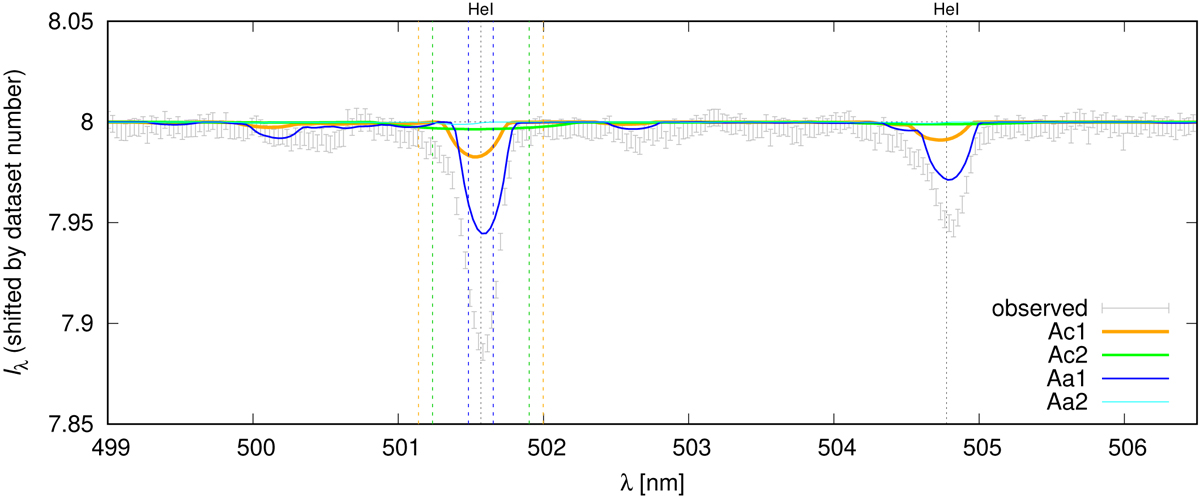
Fig. 15.
Download original image
Synthetic spectra of individual components (Ac1, Ac2, Aa1, Aa2) weighted by their luminosities to show their contributions to the total spectrum. For comparison, the observed spectrum is plotted (error bars). The region of the He I 5016 and 5047 lines is plotted. The Ac2 component is fast-rotating and has broad lines; the Aa2 component is not luminous and its contribution is negligible.
Current usage metrics show cumulative count of Article Views (full-text article views including HTML views, PDF and ePub downloads, according to the available data) and Abstracts Views on Vision4Press platform.
Data correspond to usage on the plateform after 2015. The current usage metrics is available 48-96 hours after online publication and is updated daily on week days.
Initial download of the metrics may take a while.