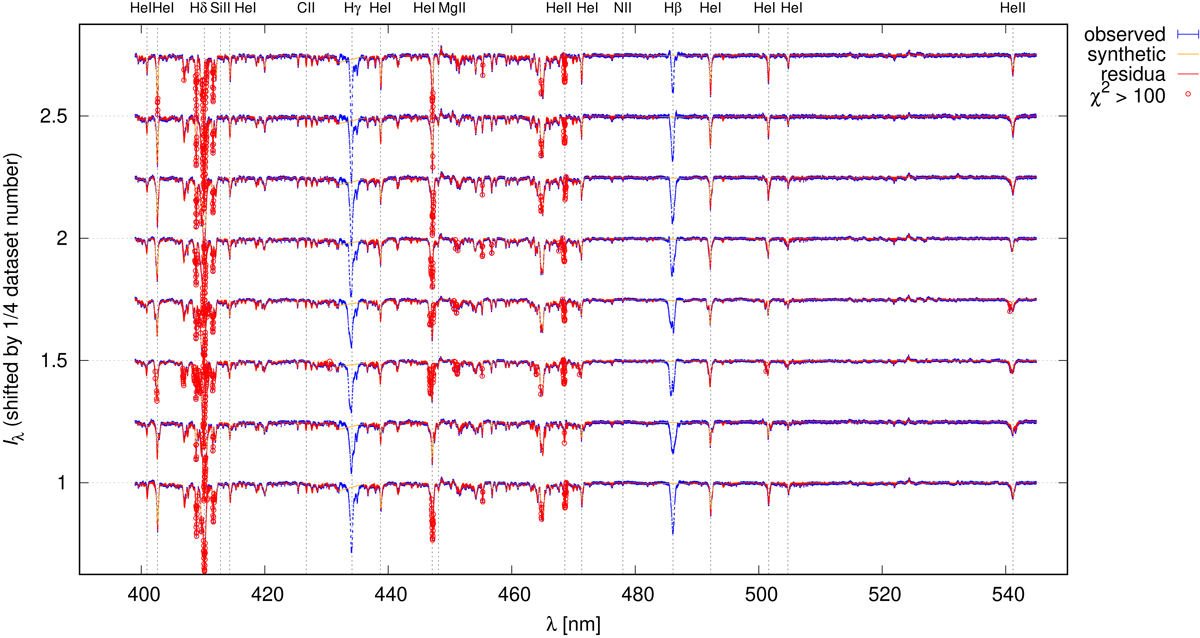
Fig. 10.
Download original image
Comparison of the rectified observed FEROS spectra (blue) with the synthetic spectra computed by our N-body model (orange). Residuals are also plotted (red). They are substantial for the Hδ line (see circles), where the continuum level is uncertain (between 405.1 and 412.6 nm). Nevertheless, most line features (including splits, blends, weak lines close to the continuum) are present in both observed and synthetic spectra, resulting in reliable RVs of individual stellar components (especially Ac1, Aa1; cf. Fig. 15).
Current usage metrics show cumulative count of Article Views (full-text article views including HTML views, PDF and ePub downloads, according to the available data) and Abstracts Views on Vision4Press platform.
Data correspond to usage on the plateform after 2015. The current usage metrics is available 48-96 hours after online publication and is updated daily on week days.
Initial download of the metrics may take a while.