Fig. 8
Download original image
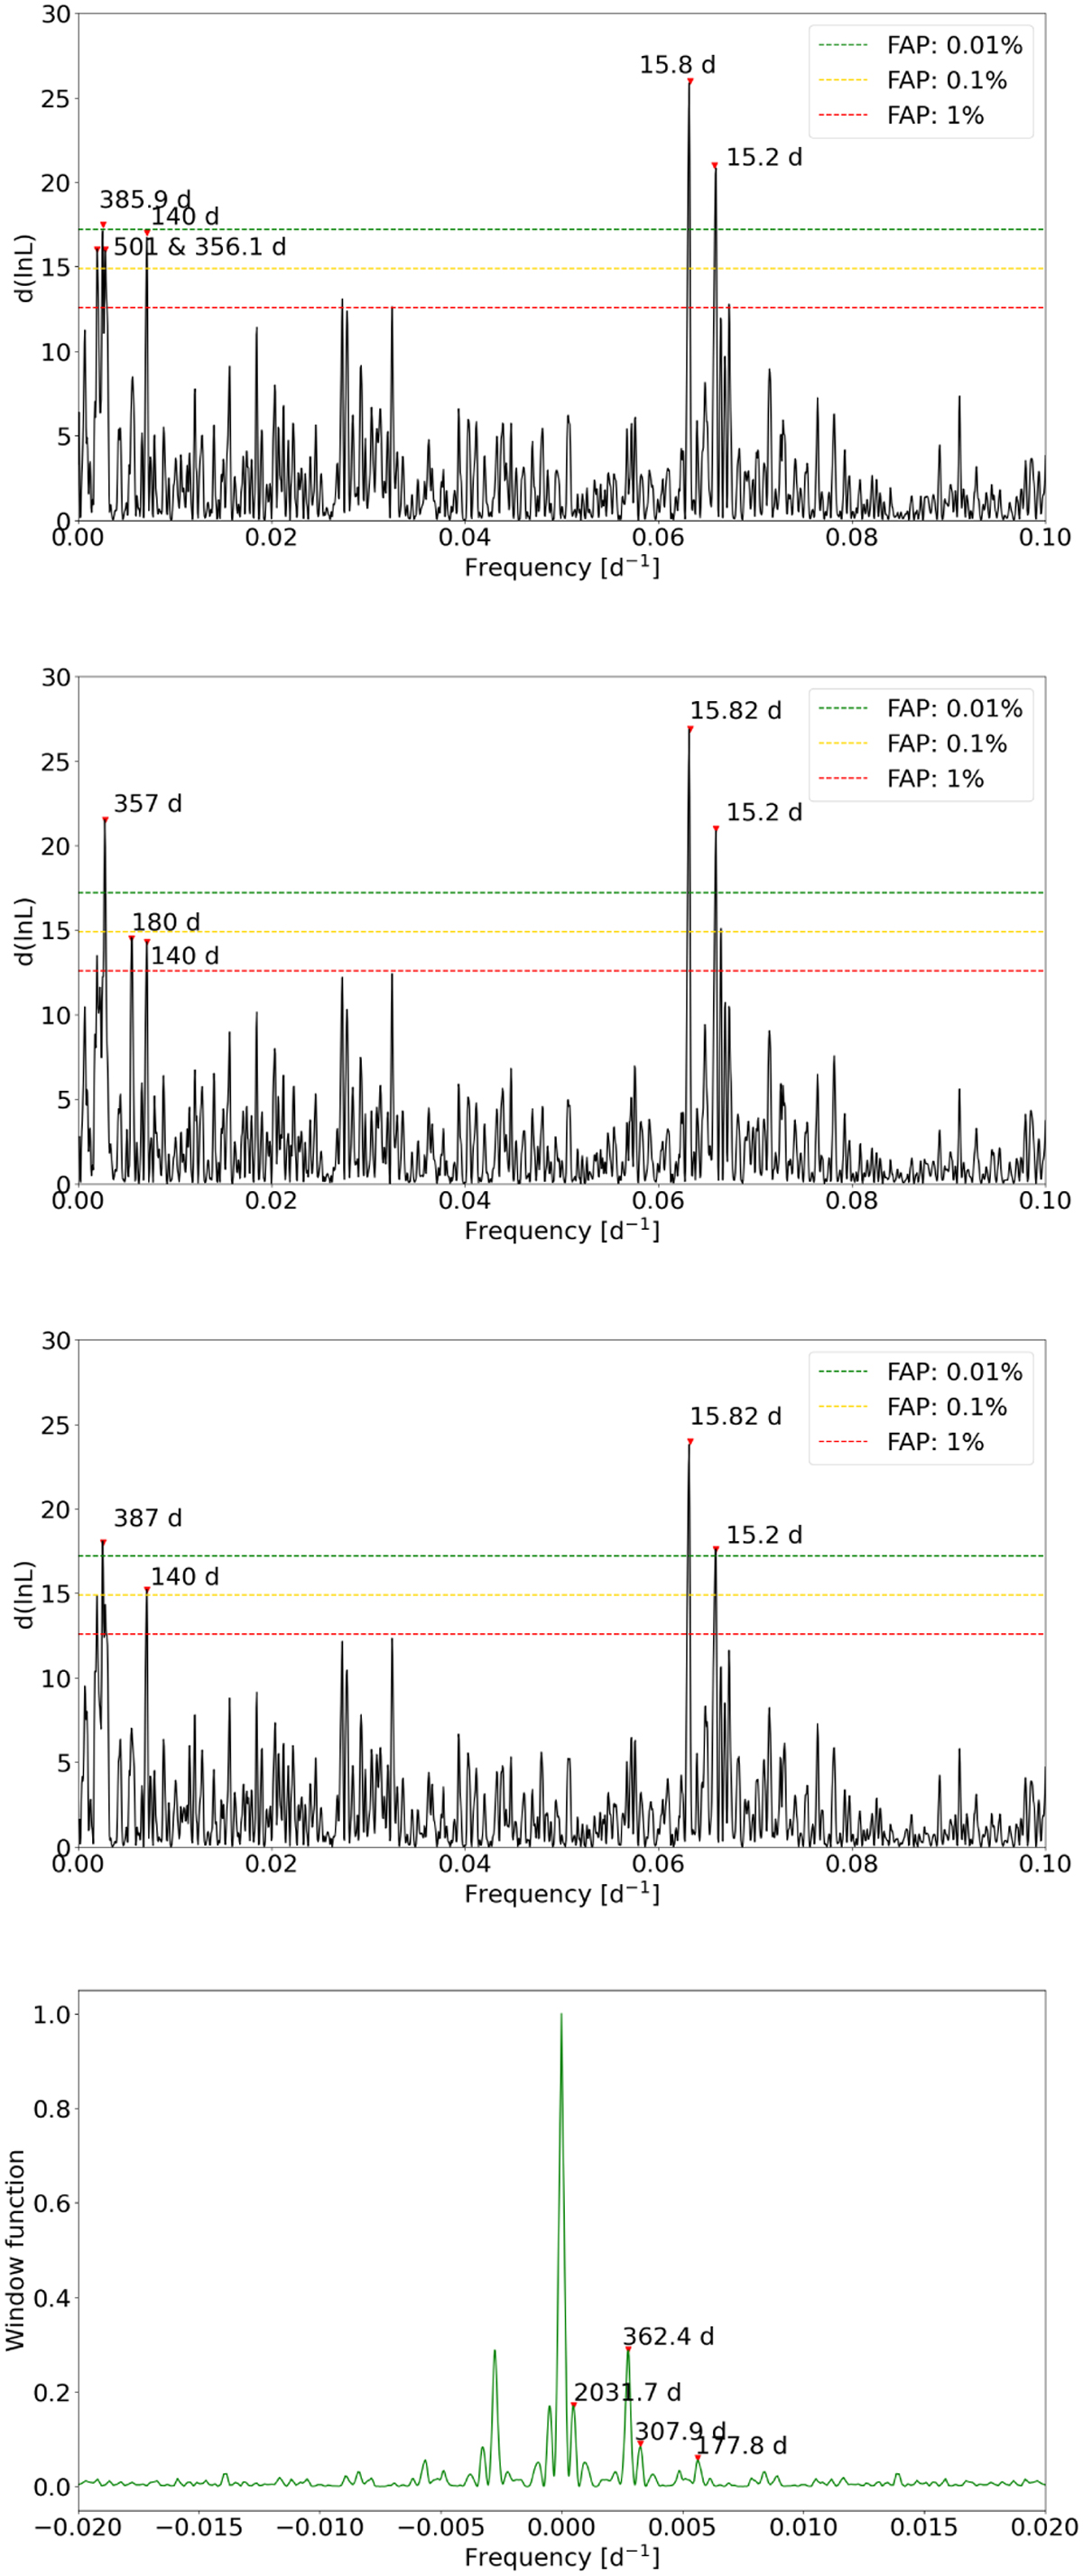
Maximum-likelihood periodograms of the joint HARPS (preand post-2015) and CARMENES-VIS RVs (panel 1: HARPSTERRA; panel 2: HARPSNAIRA; panel 3: HARPSTrifonov et al.). The periods corresponding to the highest peaks are indicated, as are the analytical FAP levels. Offsets have been subtracted from the HARPS and CARMENES RVs, as derived by the MLP procedure. Lower panel: window function of the combined dataset.
Current usage metrics show cumulative count of Article Views (full-text article views including HTML views, PDF and ePub downloads, according to the available data) and Abstracts Views on Vision4Press platform.
Data correspond to usage on the plateform after 2015. The current usage metrics is available 48-96 hours after online publication and is updated daily on week days.
Initial download of the metrics may take a while.