Open Access
Fig. 6
Download original image
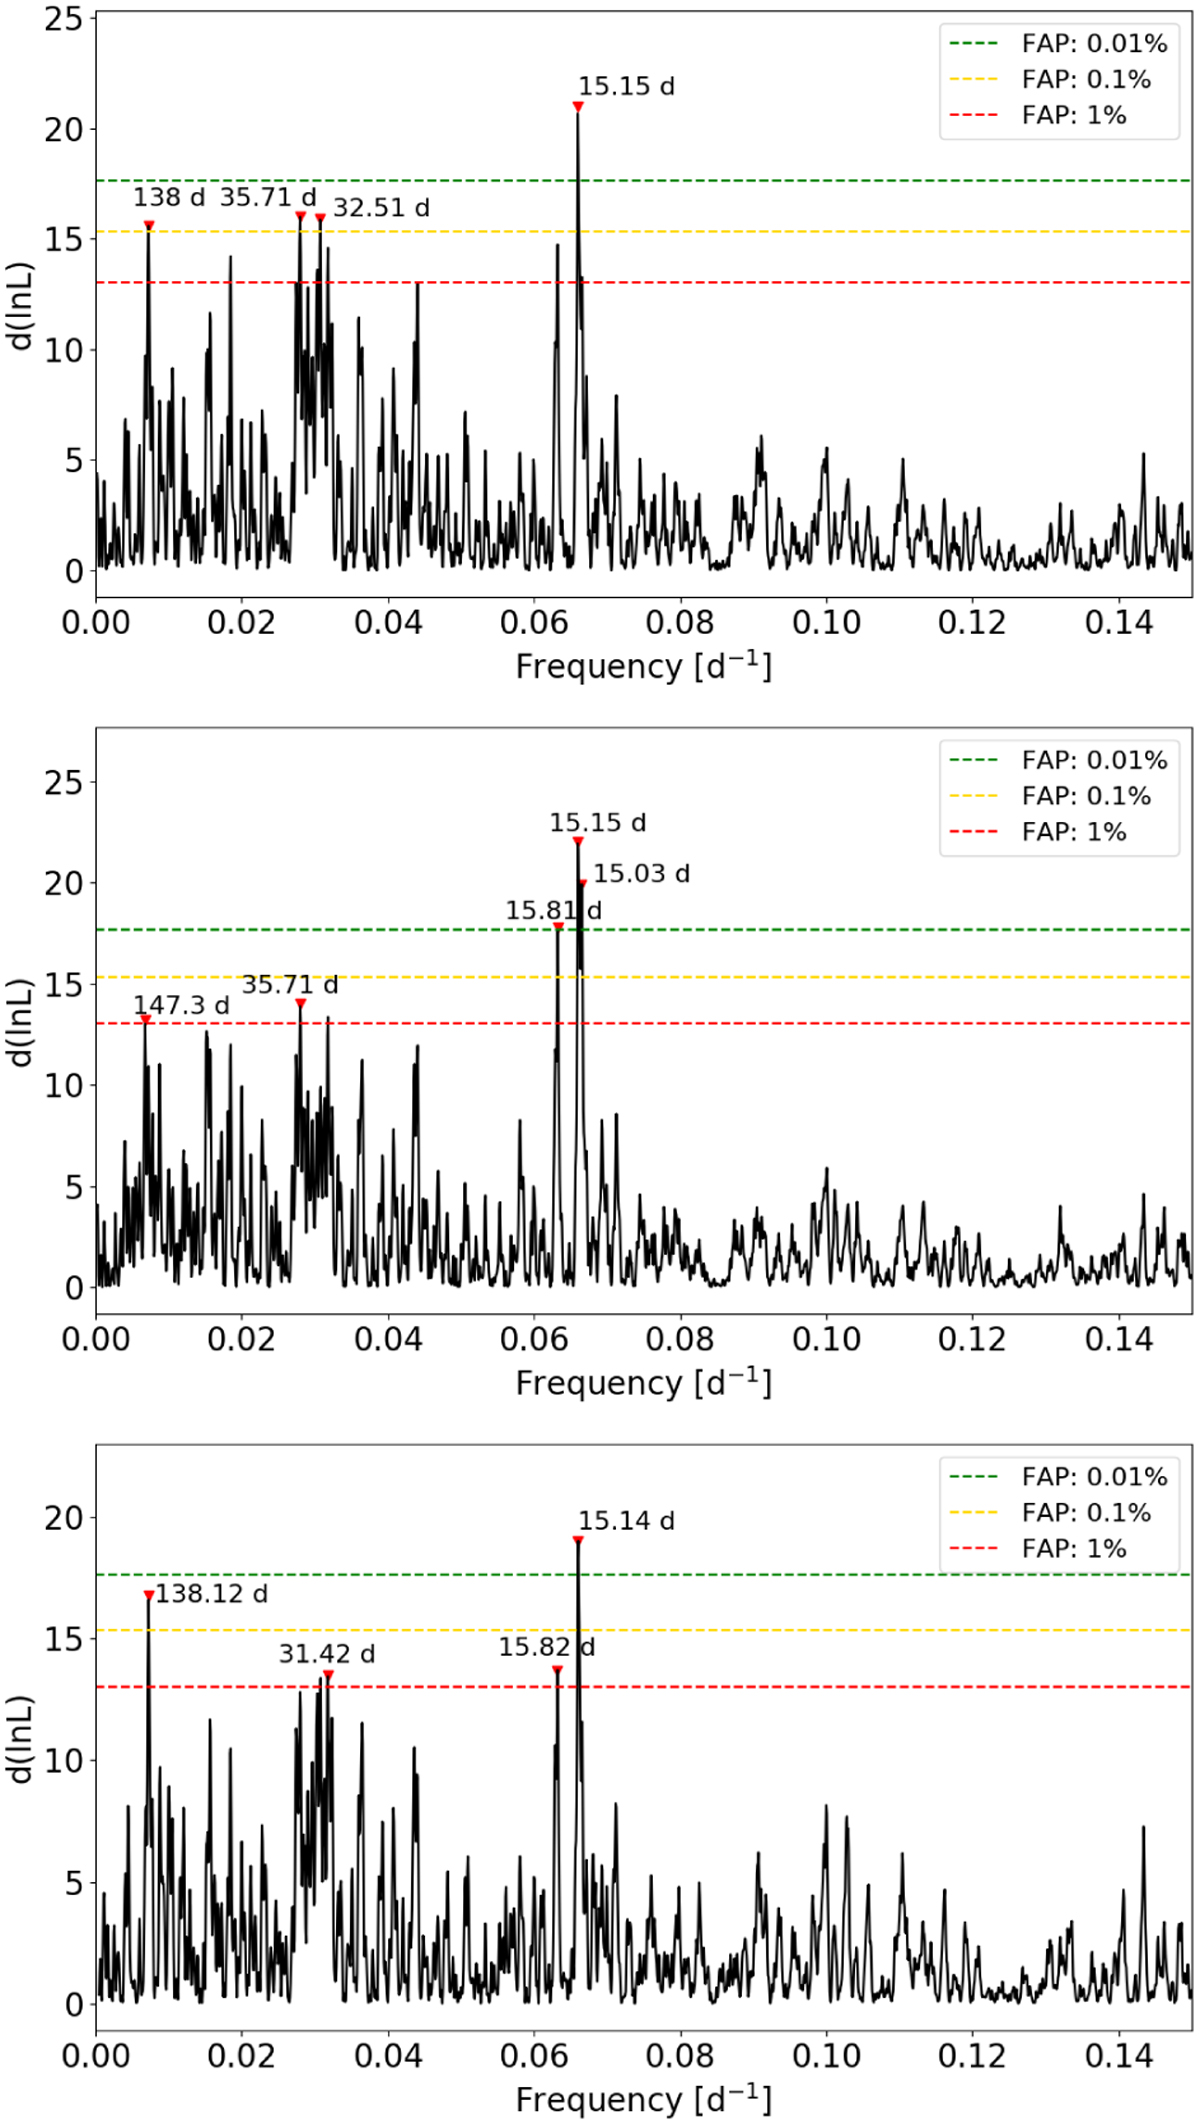
Maximum-likelihood periodogram of the HARPS TERRA (first panel), NAIRA (second panel), and Trifonov et al. (2020; third panel) RVs (pre- and post-2015 combined dataset). The periods corresponding to the four highest peaks are indicated, as are the analytical FAP levels.
Current usage metrics show cumulative count of Article Views (full-text article views including HTML views, PDF and ePub downloads, according to the available data) and Abstracts Views on Vision4Press platform.
Data correspond to usage on the plateform after 2015. The current usage metrics is available 48-96 hours after online publication and is updated daily on week days.
Initial download of the metrics may take a while.