Fig. 3
Download original image
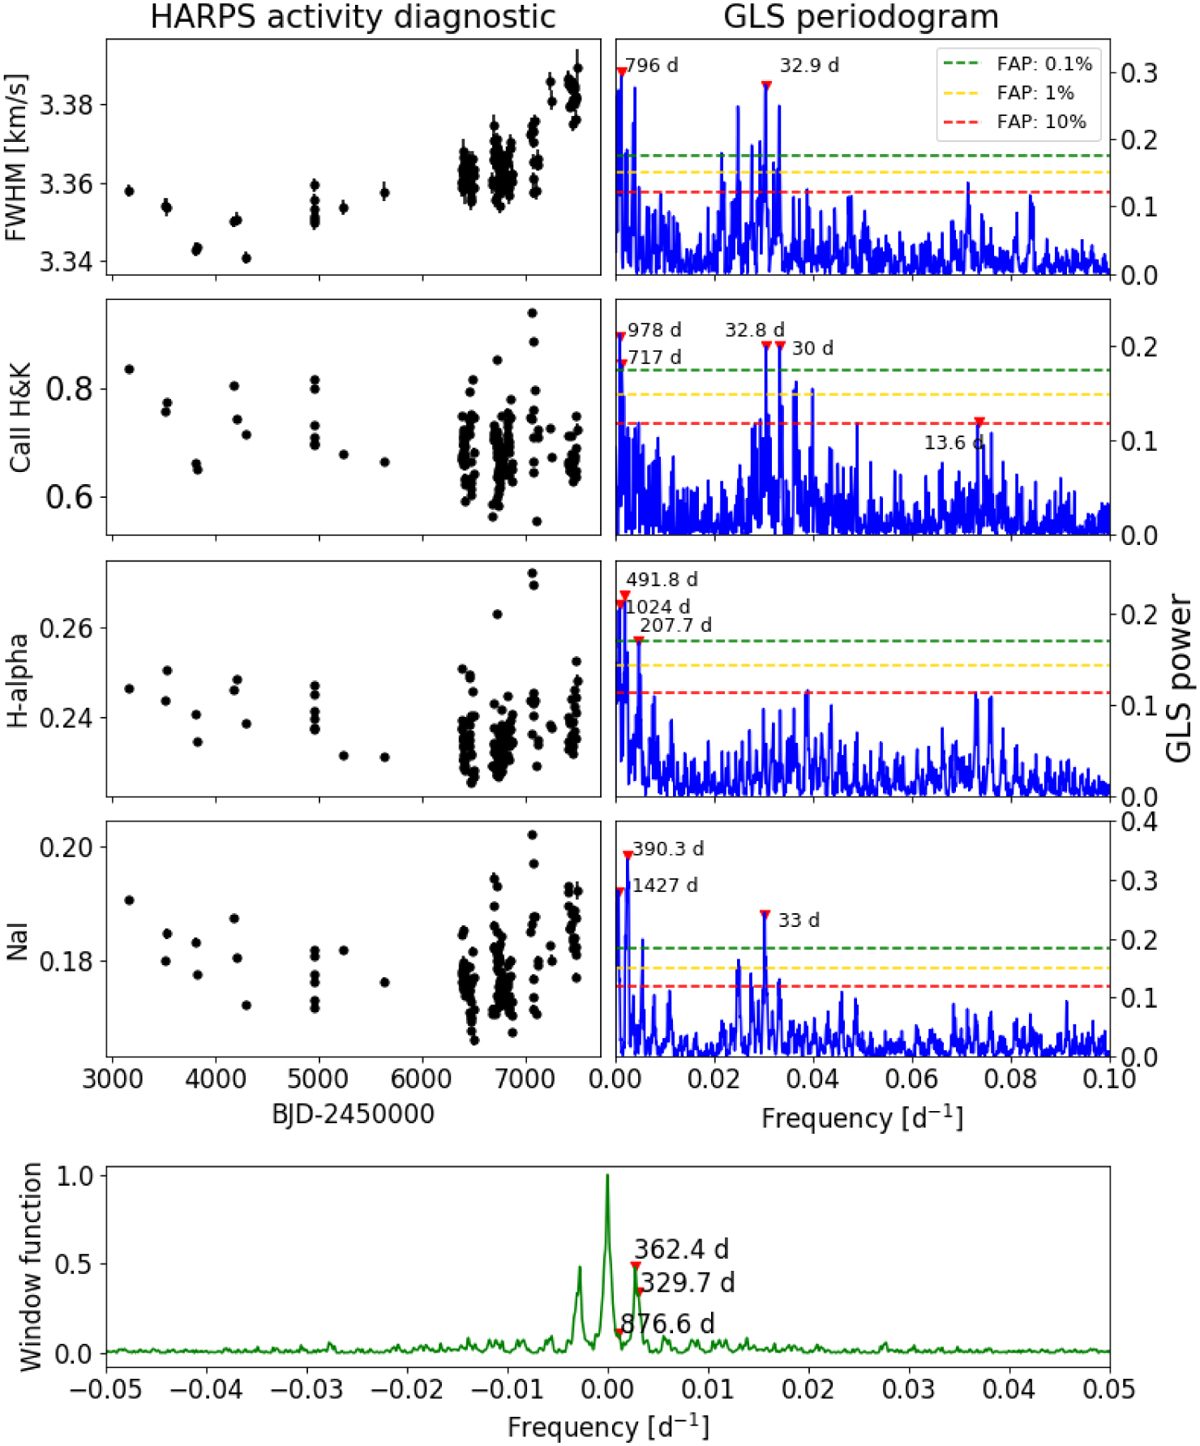
Time-series and GLS periodograms for activity diagnostics derived from HARPS spectra. Rows 1–4: time series (left panels) and periodograms (right panels) of the CCF FWHM, and activity indexes derived from the spectral lines CaII H&K, Hα and NaI. For the FWHM, we show the periodogram of the residuals, after removing the long-term trend clearly seen in the time series. The levels of FAPs are indicated as horizontal dashed lines (green: FAP 0.1%; yellow: 1%; red: 10%), and are determined through a bootstrap analysis. Last row: Window function of the data.
Current usage metrics show cumulative count of Article Views (full-text article views including HTML views, PDF and ePub downloads, according to the available data) and Abstracts Views on Vision4Press platform.
Data correspond to usage on the plateform after 2015. The current usage metrics is available 48-96 hours after online publication and is updated daily on week days.
Initial download of the metrics may take a while.