Fig. C.4
Download original image
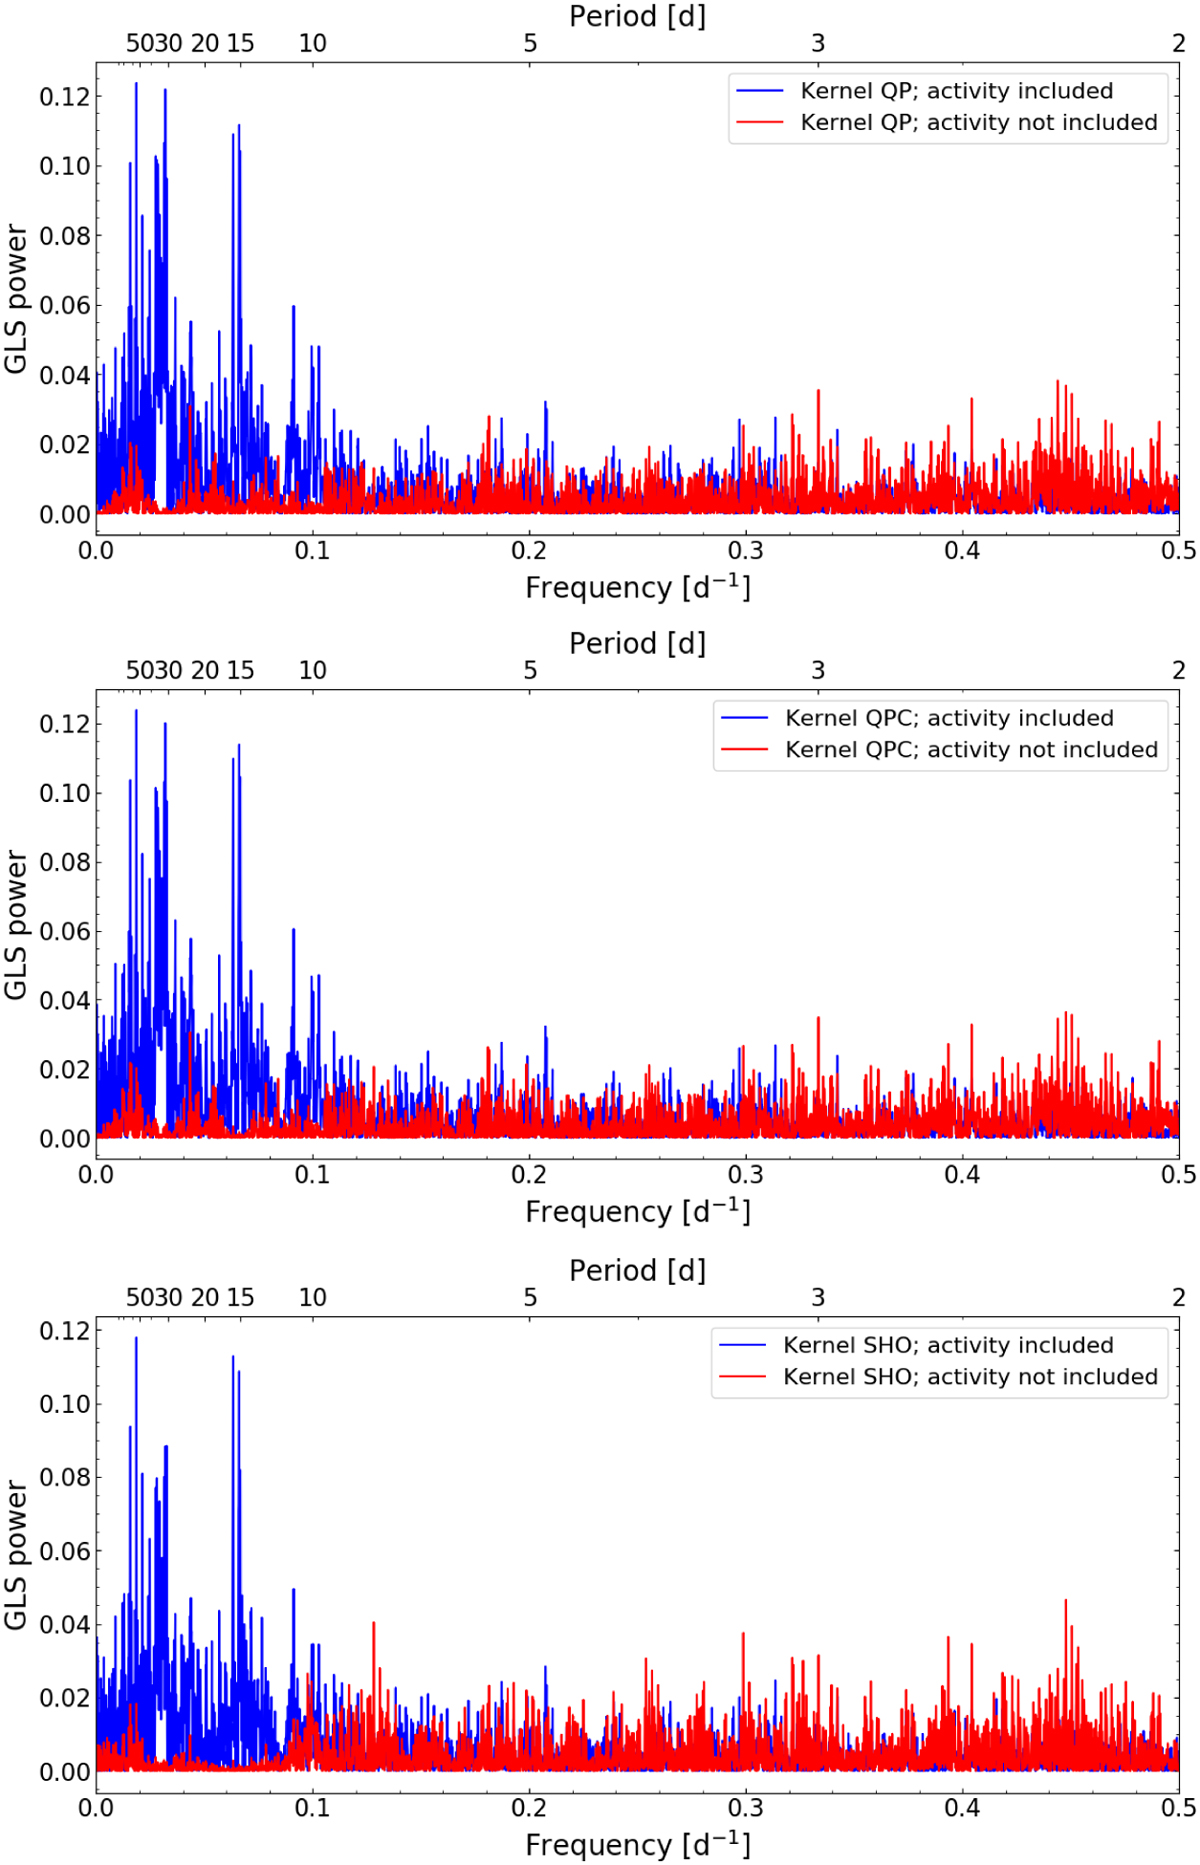
GLS periodograms of the HARPSterra+CARMENES RV residuals, after removing the best-fit models shown in the second columns of Table C.1–C.2. For each kernel, periodograms of data with and without the correlated activity signal included are shown. The periodograms were calculated with the uncorrelated jitter terms added in quadrature to the formal RV uncertainties.
Current usage metrics show cumulative count of Article Views (full-text article views including HTML views, PDF and ePub downloads, according to the available data) and Abstracts Views on Vision4Press platform.
Data correspond to usage on the plateform after 2015. The current usage metrics is available 48-96 hours after online publication and is updated daily on week days.
Initial download of the metrics may take a while.