Open Access
Fig. 2
Download original image
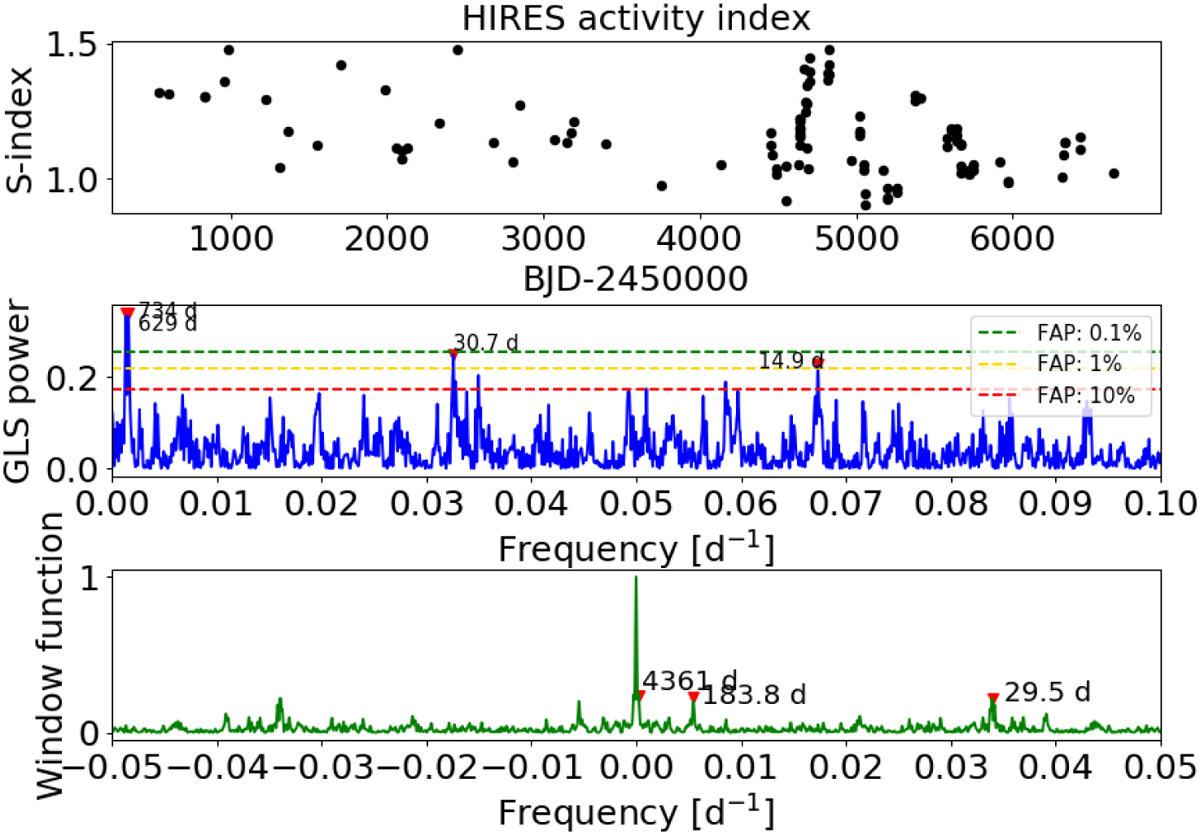
Time series and GLS periodogram of the chromospheric activity S-index derived from HIRES spectra (first and second row). The levels of FAPs are indicated as horizontal dashed lines (green: FAP 0.1%; yellow: 1%; red: 10%), and have been determined through a bootstrap analysis. Third row: Window function of the data.
Current usage metrics show cumulative count of Article Views (full-text article views including HTML views, PDF and ePub downloads, according to the available data) and Abstracts Views on Vision4Press platform.
Data correspond to usage on the plateform after 2015. The current usage metrics is available 48-96 hours after online publication and is updated daily on week days.
Initial download of the metrics may take a while.