Fig. 13
Download original image
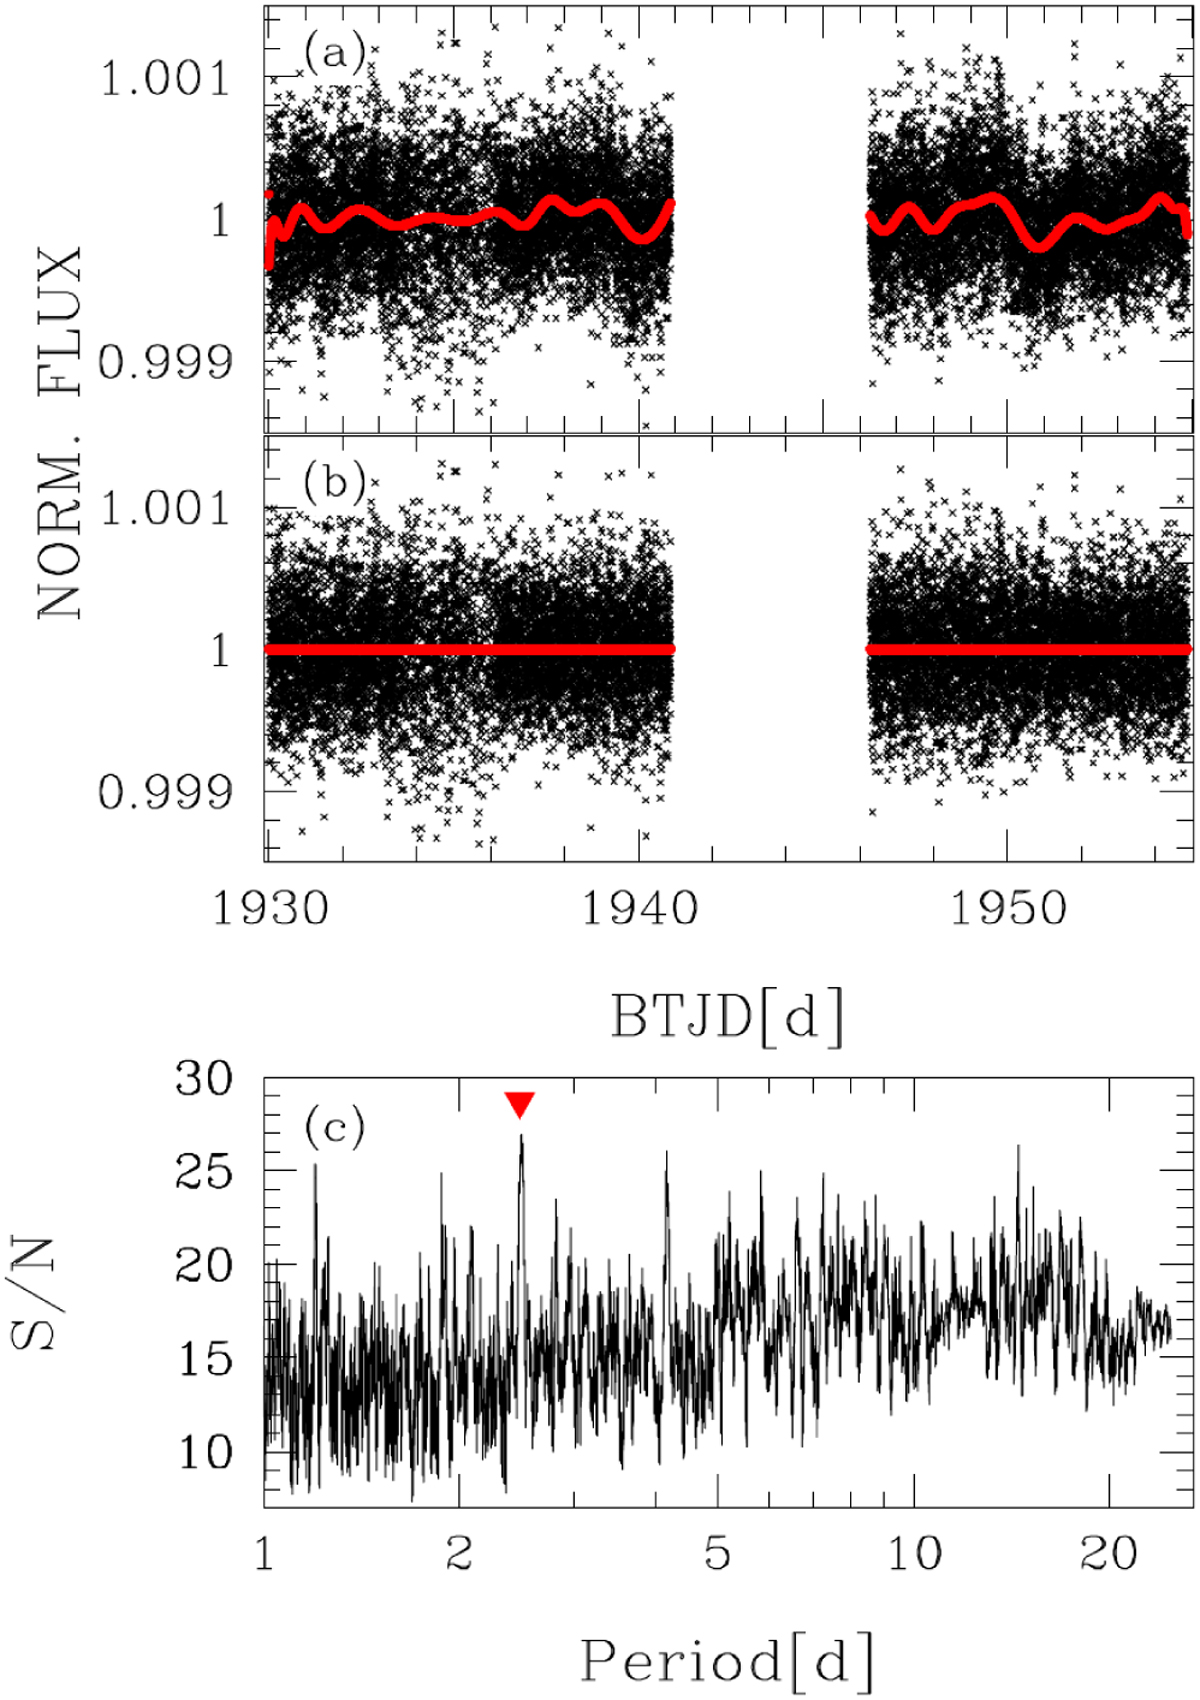
TESS short-cadence light curve of Gl 514. Panels a and b show the normalised light curves before and after the subtraction of the model, respectively; the model represented in red in panel a was calculated on a grid of knots spaced every 24h. Time is expressed as the TESS Barycenter-corrected Julian Day (BTJD = BJD - 2457 000). Panel c shows the BLS periodogram. The red triangle indicates the period associated with the highest S/N.
Current usage metrics show cumulative count of Article Views (full-text article views including HTML views, PDF and ePub downloads, according to the available data) and Abstracts Views on Vision4Press platform.
Data correspond to usage on the plateform after 2015. The current usage metrics is available 48-96 hours after online publication and is updated daily on week days.
Initial download of the metrics may take a while.