Fig. 6
Download original image
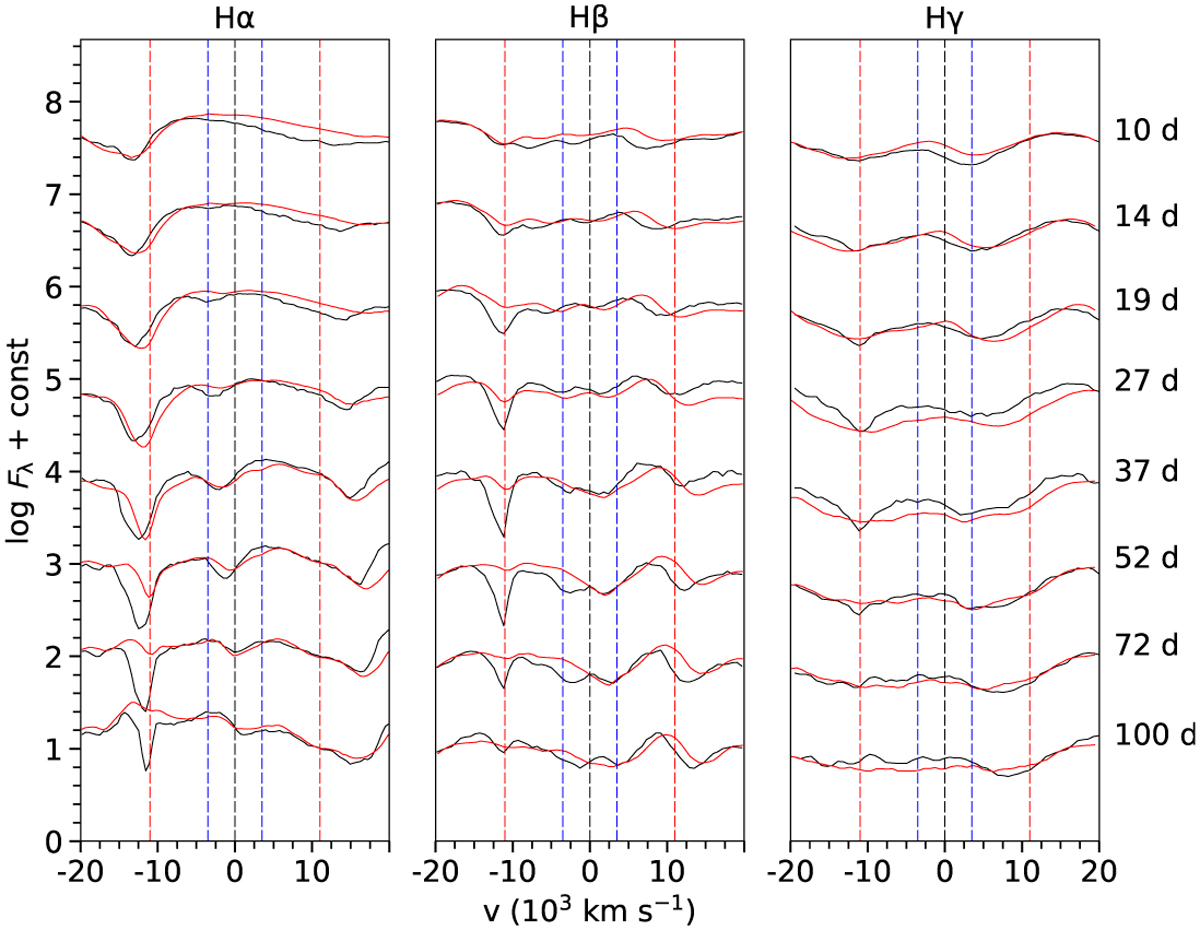
Evolution of hydrogen lines for the standard model (black) compared with the observations of SN 2011dh (red). Spectra from eight logarithmically spaced epochs between 10 and 100 days are shown; the model and observed spectra at each epoch have been shifted by the same, but otherwise arbitrary, amount. Here, as well as in Figs. 7–10, we also show the velocity extent of the helium envelope (red lines) and the carbon–oxygen core (blue lines).
Current usage metrics show cumulative count of Article Views (full-text article views including HTML views, PDF and ePub downloads, according to the available data) and Abstracts Views on Vision4Press platform.
Data correspond to usage on the plateform after 2015. The current usage metrics is available 48-96 hours after online publication and is updated daily on week days.
Initial download of the metrics may take a while.