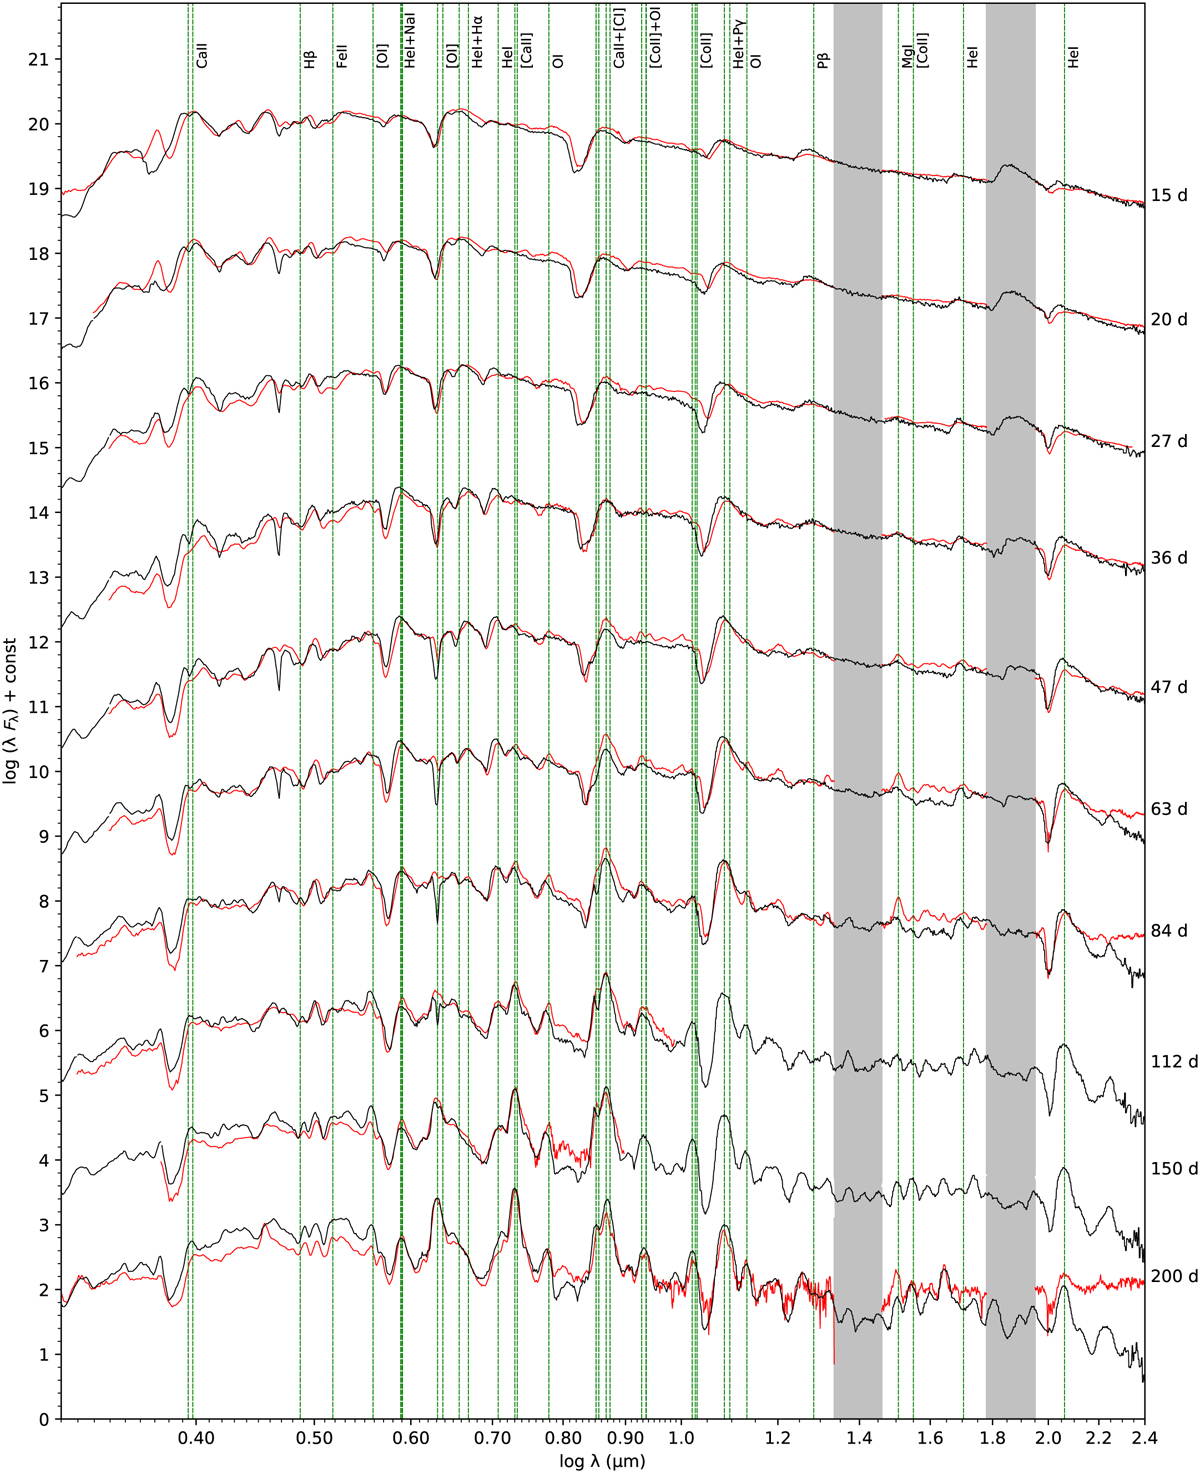
Fig. 5
Download original image
Spectral evolution for the standard model (black) compared with the observations of SN 2011dh (red). Spectra from ten logarithmically spaced epochs between 15 and 200 days are shown; the model and observed spectra at each epoch have been shifted by the same, but otherwise arbitrary, amount. Here and in the following figures the spectra of SN 2011dh have been interpolated as described in E14, but we only show interpolations that have an observational counterpart close (less than 20%) in time. In addition, the rest wavelengths of the most important lines are shown as dashed red lines and the NIR telluric absorption bands as vertical grey bars.
Current usage metrics show cumulative count of Article Views (full-text article views including HTML views, PDF and ePub downloads, according to the available data) and Abstracts Views on Vision4Press platform.
Data correspond to usage on the plateform after 2015. The current usage metrics is available 48-96 hours after online publication and is updated daily on week days.
Initial download of the metrics may take a while.