Fig. 21
Download original image
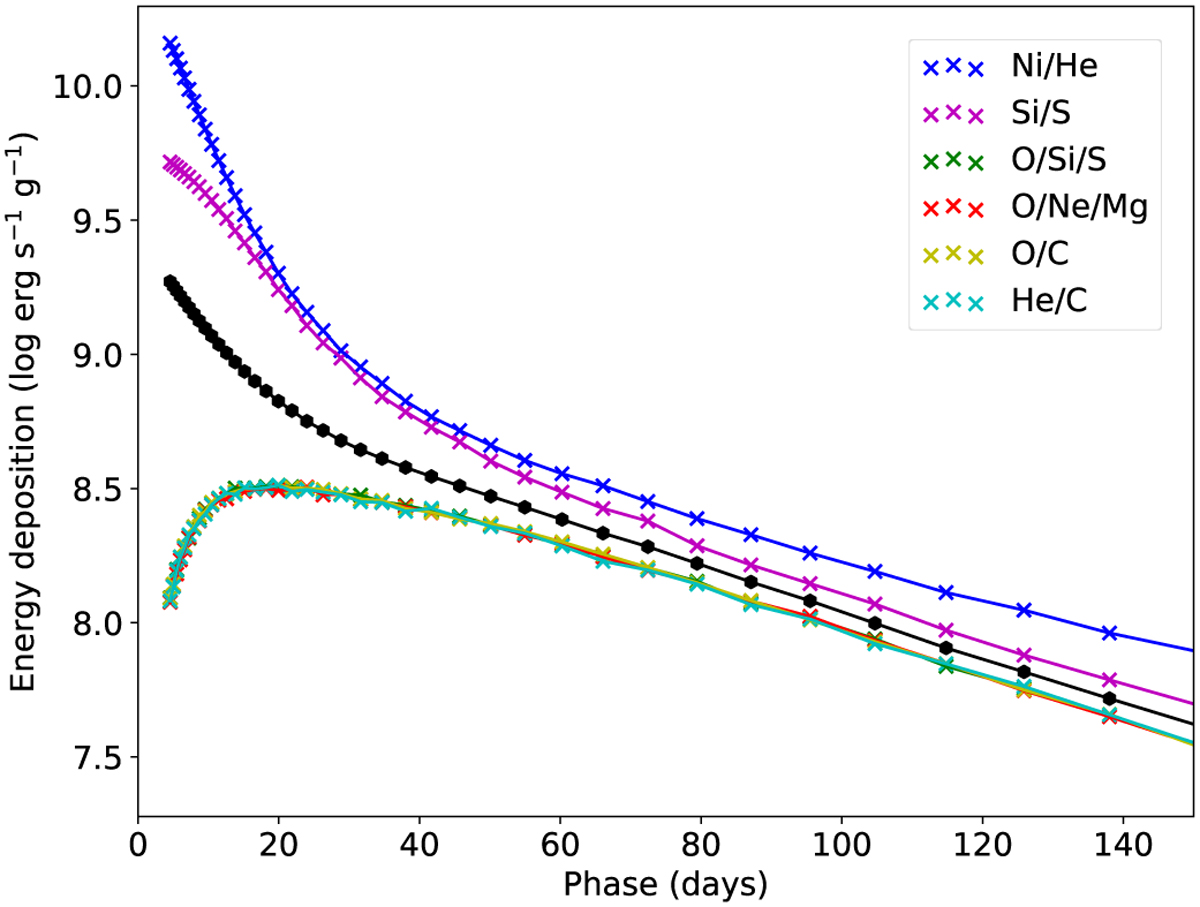
Evolution of the radioactive energy deposition in the Ni/He (blue), Si/S (magenta), O/Si/S (green), O/Ne/Mg (red), O/C (yellow), and He/C (cyan) clumps in the core (υ = 2900 km s−1) of the macroscopically mixed standard model and the core of the microscopically mixed model (black). We note that the energy deposition is similar in the oxygen- and helium-rich clumps, so these curves overlap.
Current usage metrics show cumulative count of Article Views (full-text article views including HTML views, PDF and ePub downloads, according to the available data) and Abstracts Views on Vision4Press platform.
Data correspond to usage on the plateform after 2015. The current usage metrics is available 48-96 hours after online publication and is updated daily on week days.
Initial download of the metrics may take a while.