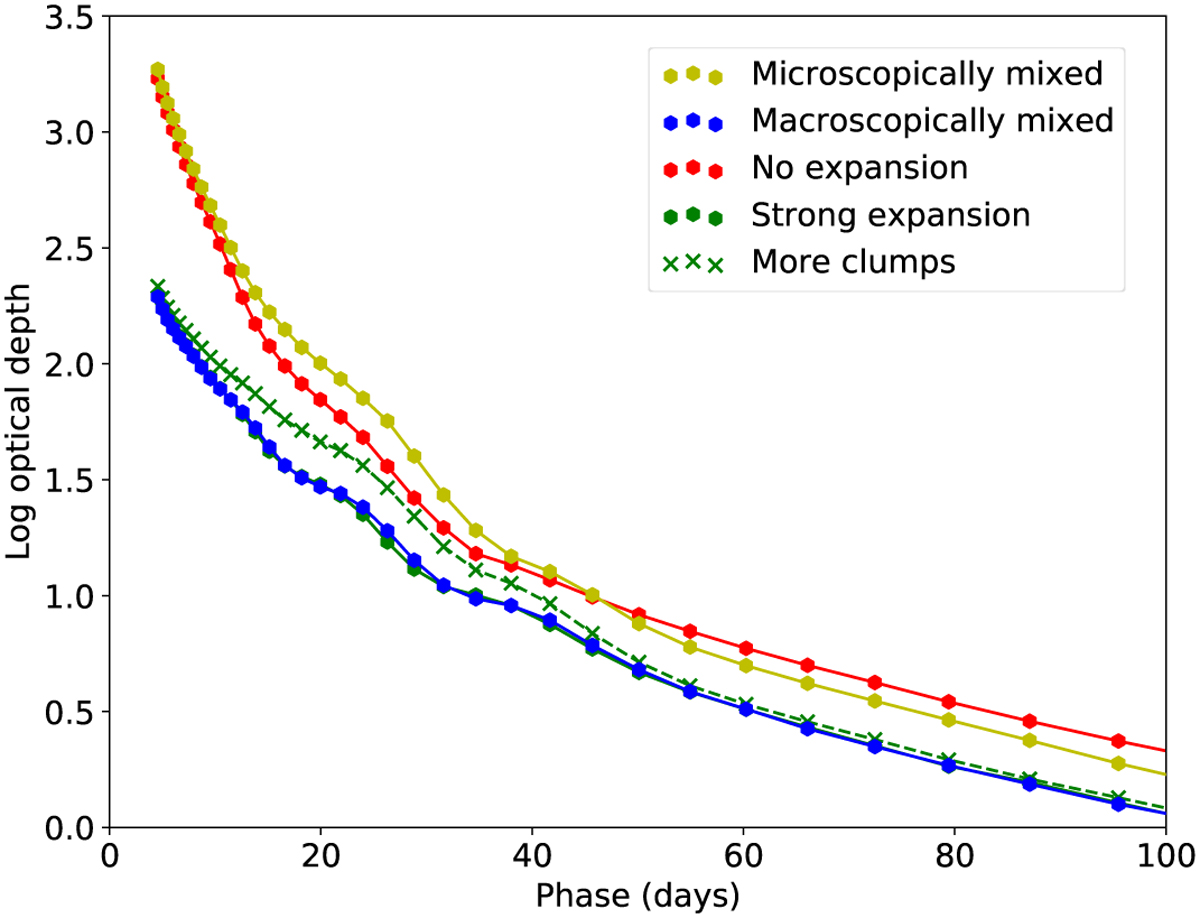
Fig. 18
Download original image
Evolution of the Rosseland mean optical depth in the core for the macroscopically mixed standard model (blue circles) compared with the microscopically mixed model (red circles). In addition, we show the macroscopically mixed models with no expansion (yellow circles), strong expansion (green circles), and more clumps (green crosses).
Current usage metrics show cumulative count of Article Views (full-text article views including HTML views, PDF and ePub downloads, according to the available data) and Abstracts Views on Vision4Press platform.
Data correspond to usage on the plateform after 2015. The current usage metrics is available 48-96 hours after online publication and is updated daily on week days.
Initial download of the metrics may take a while.