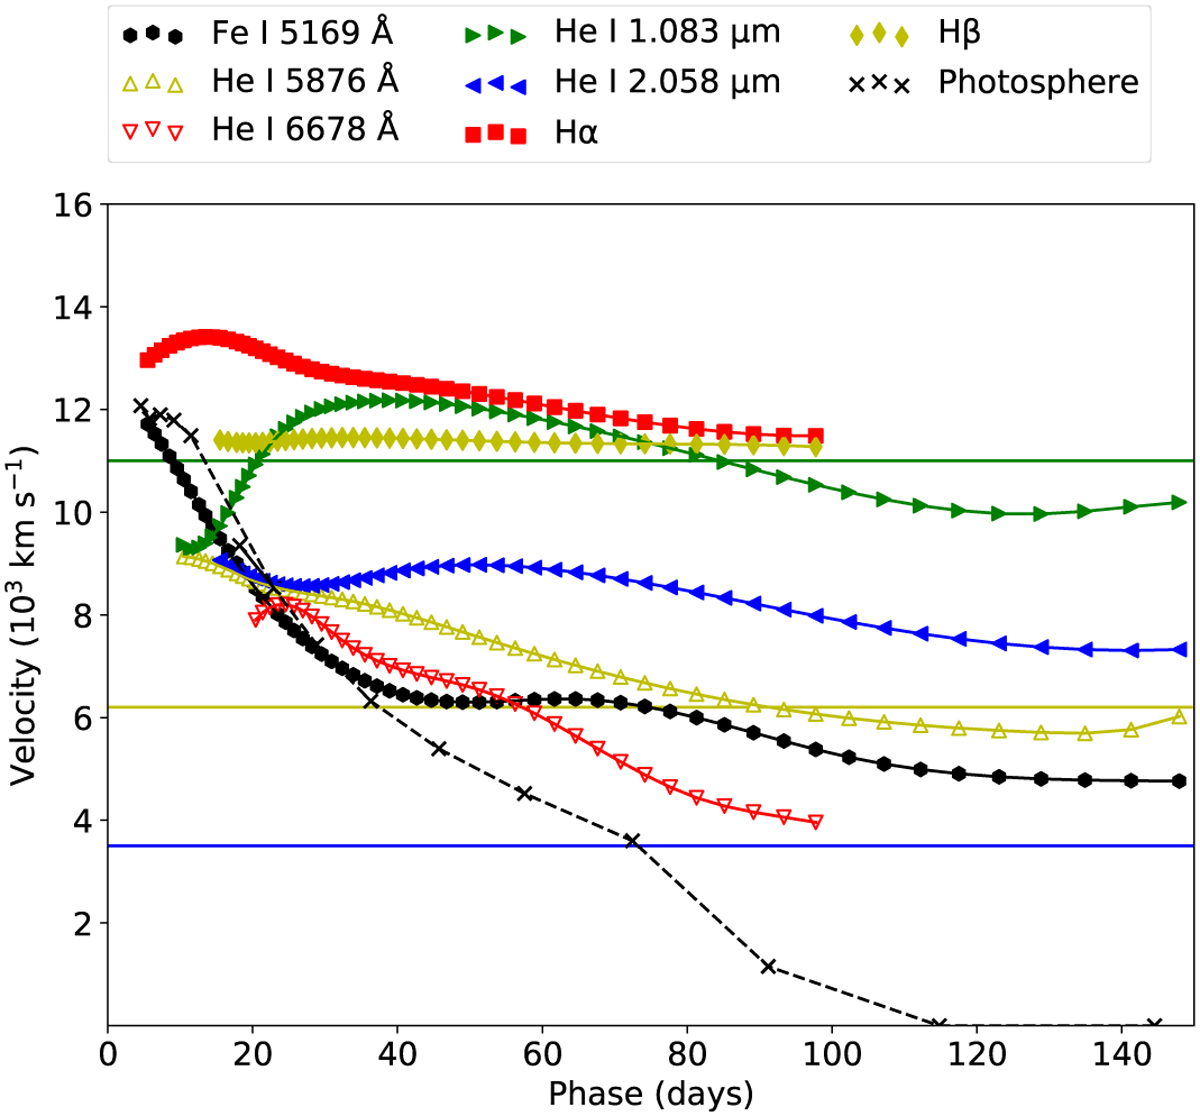
Fig. 12
Download original image
Velocity evolution of the absorption maxima of the Hα (red squares), Hß (yellow diamonds), He i 5876 Å (yellow upward triangles), He i 6678 Å (red downward triangles), He i 1.083 µm (green rightward triangles), He i 2.058 µm (blue leftward triangles), and Fen 5169 Å (black circles) lines for the standard model. The black crosses show the velocity evolution of the (Rosseland mean) continuum photosphere, whereas the horizontal lines mark the outer borders of the carbon–oxygen core (blue) and the inner and outer (green and yellow) helium envelope.
Current usage metrics show cumulative count of Article Views (full-text article views including HTML views, PDF and ePub downloads, according to the available data) and Abstracts Views on Vision4Press platform.
Data correspond to usage on the plateform after 2015. The current usage metrics is available 48-96 hours after online publication and is updated daily on week days.
Initial download of the metrics may take a while.