Open Access
Fig. 11
Download original image
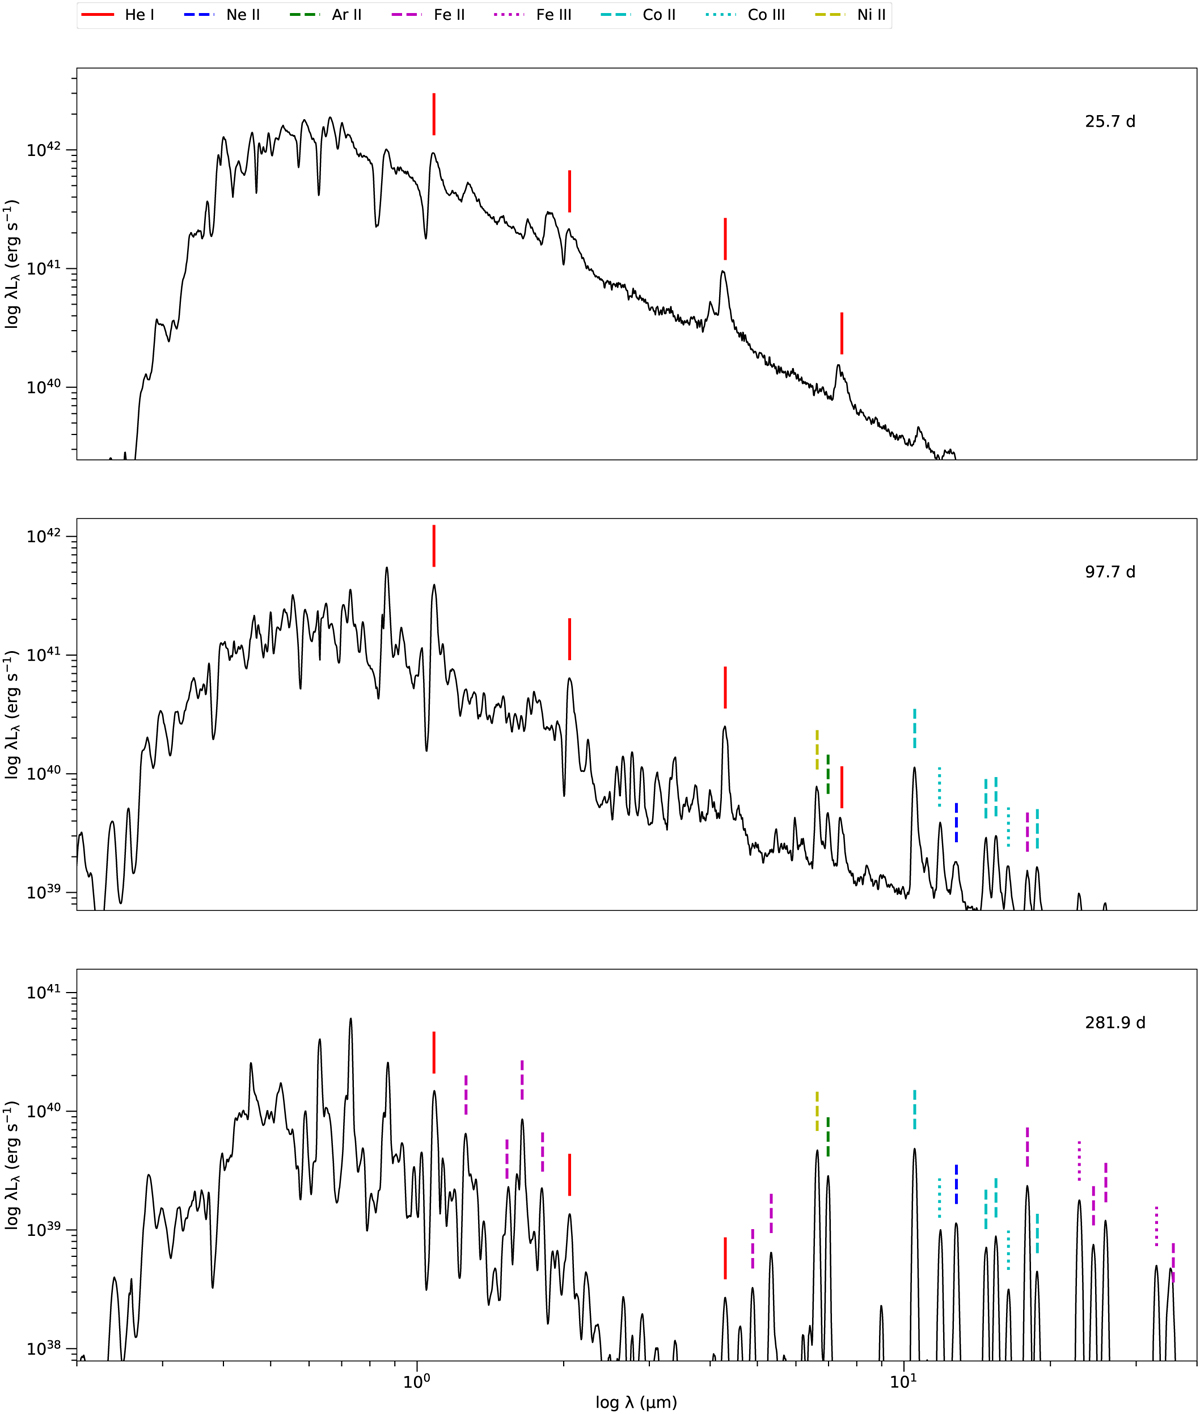
Optical, NIR, and MIR spectra for the standard model at 26 days (near peak), 98 days, and 282 days (nebular phase). The vertical lines show the strongest IR lines from the ions given in the legend at the top.
Current usage metrics show cumulative count of Article Views (full-text article views including HTML views, PDF and ePub downloads, according to the available data) and Abstracts Views on Vision4Press platform.
Data correspond to usage on the plateform after 2015. The current usage metrics is available 48-96 hours after online publication and is updated daily on week days.
Initial download of the metrics may take a while.