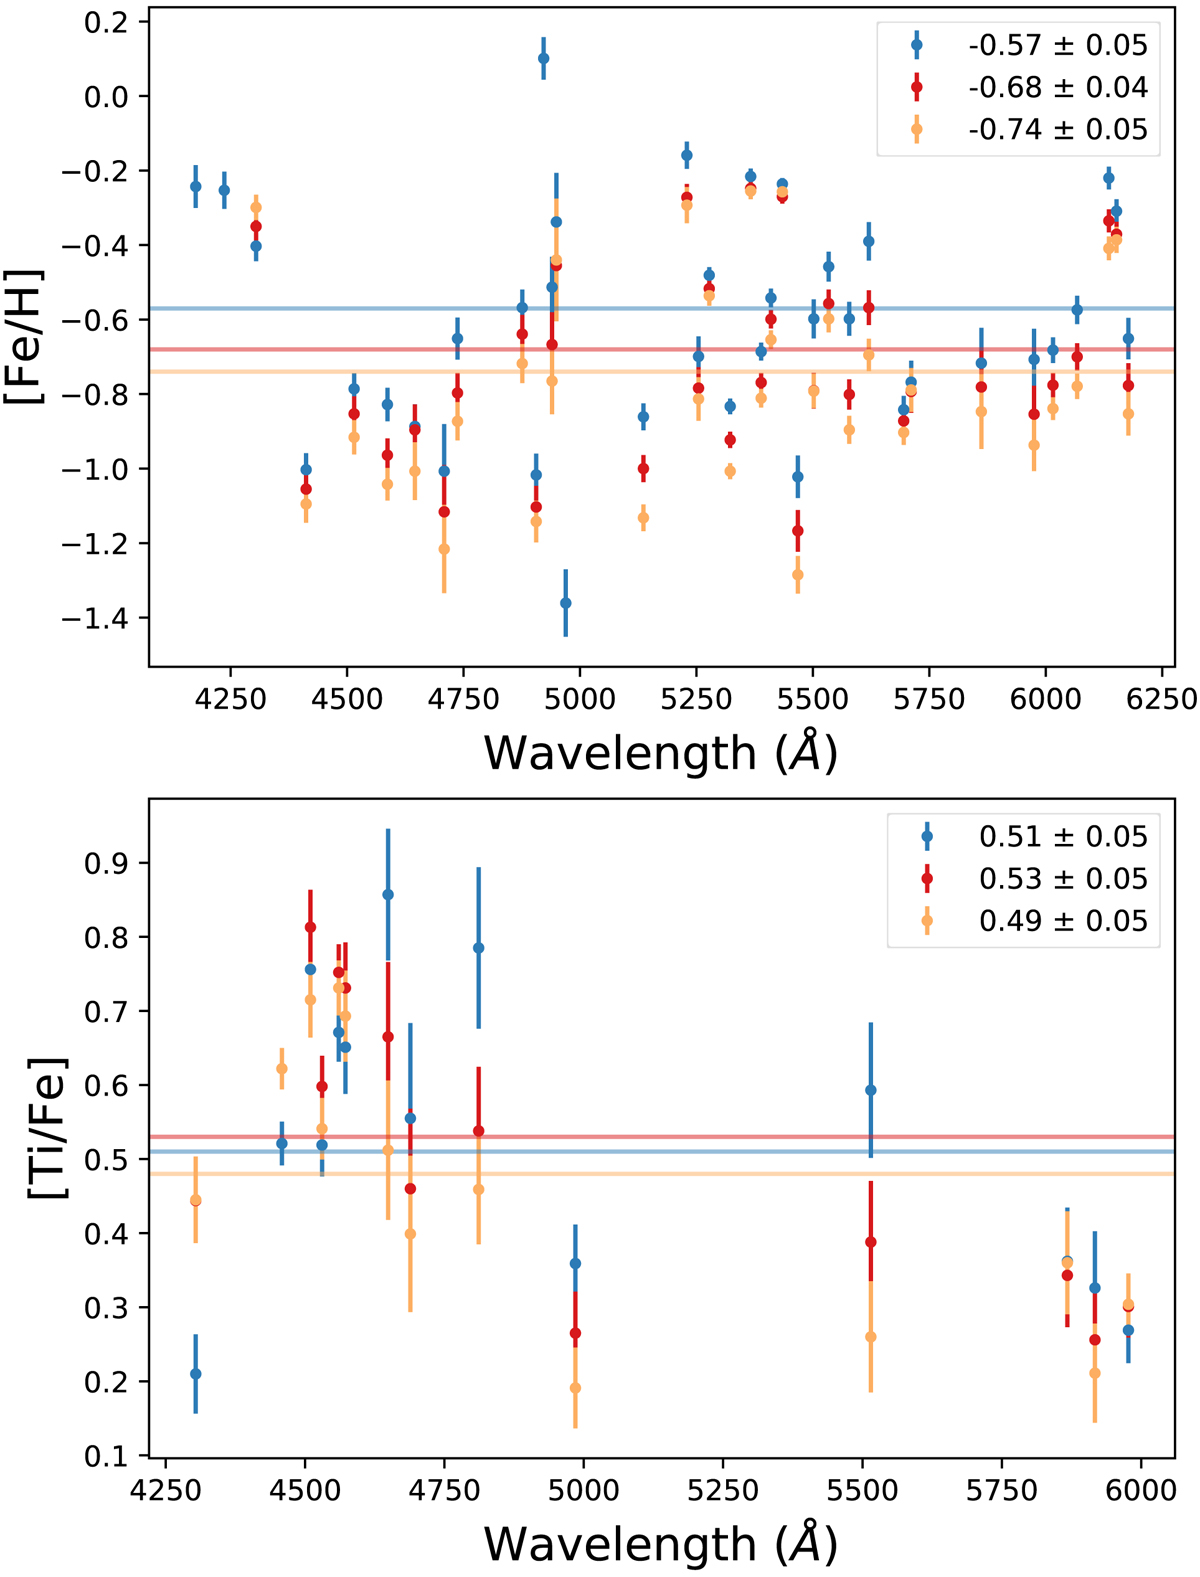
Fig. 6.
Download original image
[Fe/H] abundances derived for each of the fitted wavelength windows, shown at the top. The blue dots represent NRSG/NBSG = 1.24, the red points – NRSG/NBSG = 1.53, and yellow – NRSG/NBSG = 1.90 runs. The lines of corresponding colours indicate the averaged values of [Fe/H] for there runs. [Ti/Fe] abundances derived for each of the fitted wavelength regions shown at the bottom. The blue dots represent NRSG/NBSG = 1.24, the red points – NRSG/NBSG = 1.53, and yellow – NRSG/NBSG = 1.90 runs. The lines of corresponding colours indicate the averaged values of [Ti/Fe] for there runs.
Current usage metrics show cumulative count of Article Views (full-text article views including HTML views, PDF and ePub downloads, according to the available data) and Abstracts Views on Vision4Press platform.
Data correspond to usage on the plateform after 2015. The current usage metrics is available 48-96 hours after online publication and is updated daily on week days.
Initial download of the metrics may take a while.