Open Access
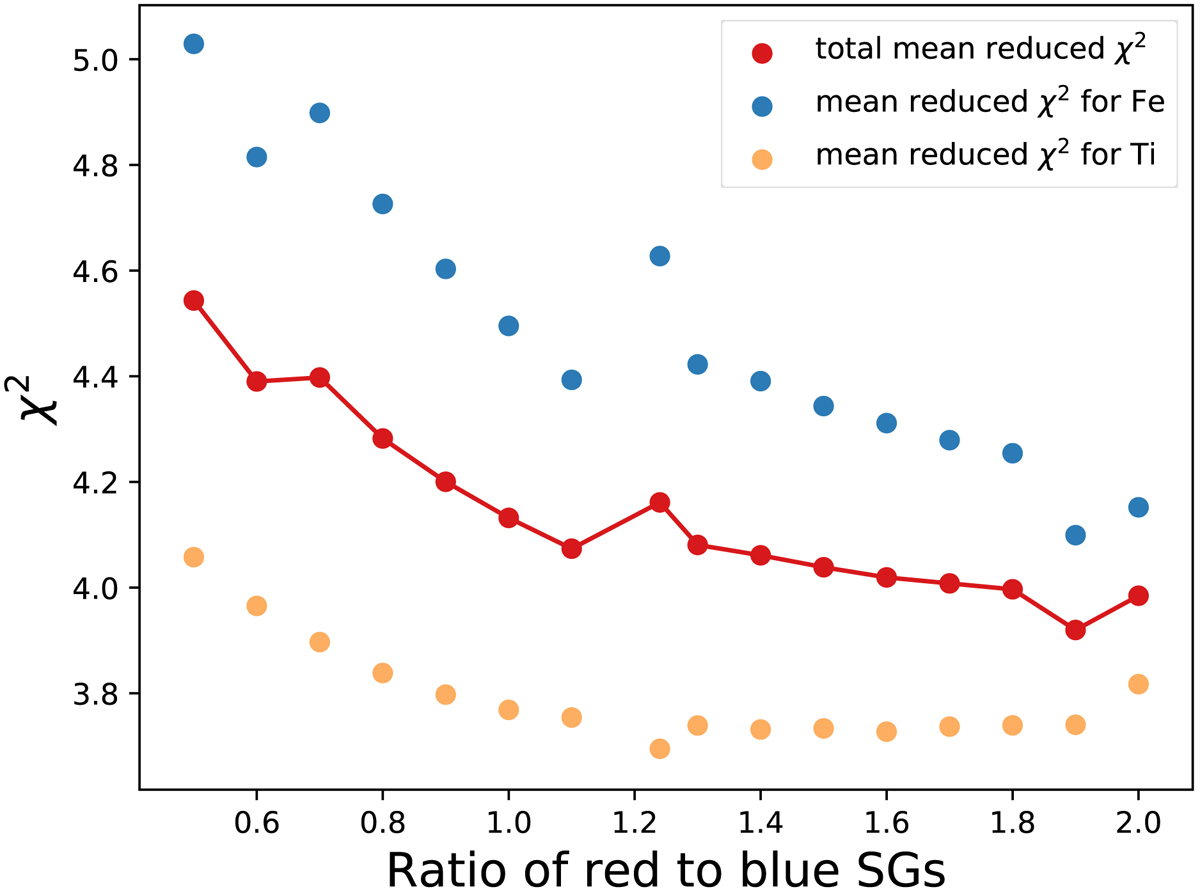
Fig. 5.
Download original image
Different ratios of NRSG/NBSG vs. the reduced χ2 values derived for the runs with these red-to-blue SG stars ratios. χ2 values were summed over all Ti and Fe lines that were fitted. The values of Fe χ2 best model fits are in blue, Ti χ2 values in orange, and the combined χ2 values in red.
Current usage metrics show cumulative count of Article Views (full-text article views including HTML views, PDF and ePub downloads, according to the available data) and Abstracts Views on Vision4Press platform.
Data correspond to usage on the plateform after 2015. The current usage metrics is available 48-96 hours after online publication and is updated daily on week days.
Initial download of the metrics may take a while.