Open Access
Fig. 3.
Download original image
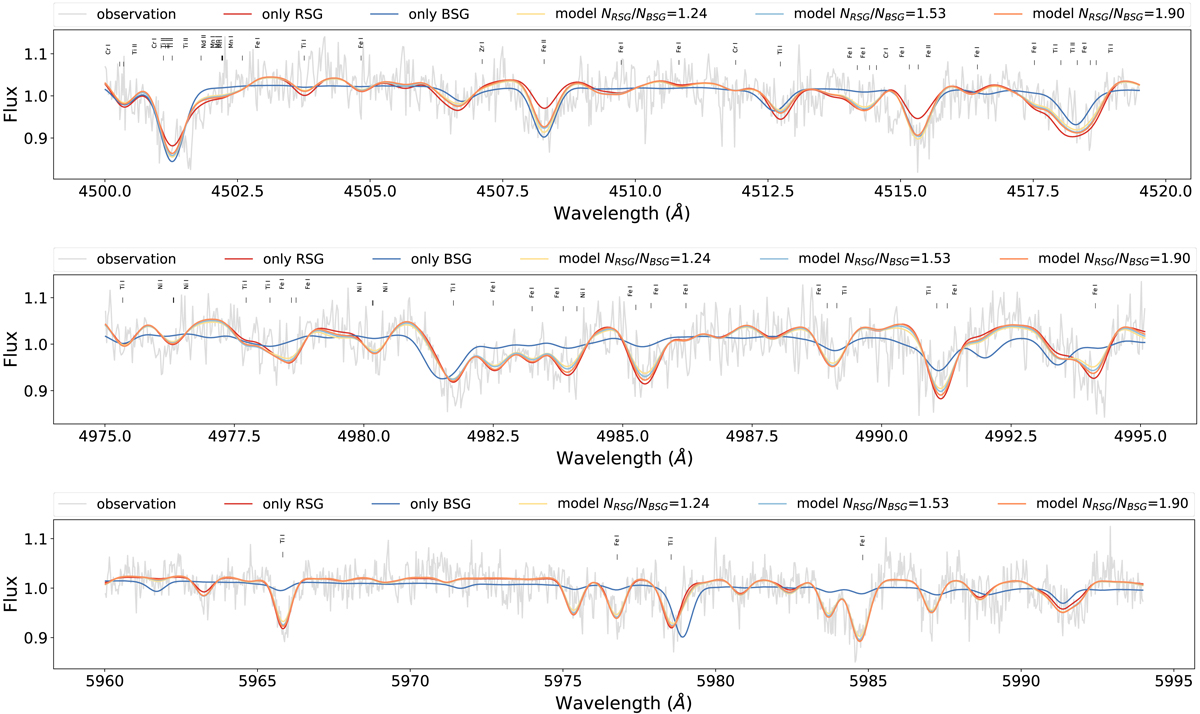
Example of the fits for three different Ti windows, grey is the observed spectrum, red is the model with no BSGs, blue is the model with no RSGs, yellow is the model with NRSG/NBSG = 1.24, light blue is the model with NRSG/NBSG = 1.53, and orange is the model with NRSG/NBSG = 1.90.
Current usage metrics show cumulative count of Article Views (full-text article views including HTML views, PDF and ePub downloads, according to the available data) and Abstracts Views on Vision4Press platform.
Data correspond to usage on the plateform after 2015. The current usage metrics is available 48-96 hours after online publication and is updated daily on week days.
Initial download of the metrics may take a while.