Fig. 3
Download original image
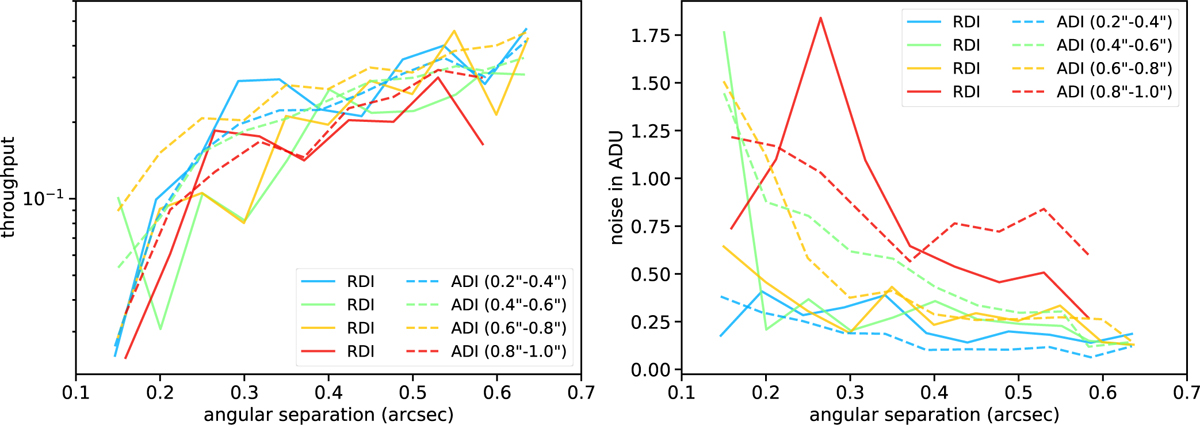
The throughput and noise correspond to the contrast curve shown in Fig. 2. Left panel: throughput of PCA subtraction using RDI (solid lines) or ADI (dashed lines) as a function of angular separations. Right panel: noise in the residual image processed with RDI (solid lines) or ADI (dashed lines) as a function of angular separations. Four bins of seeing conditions were used. The throughput and noise were averaged over targets in each bin of seeing conditions.
Current usage metrics show cumulative count of Article Views (full-text article views including HTML views, PDF and ePub downloads, according to the available data) and Abstracts Views on Vision4Press platform.
Data correspond to usage on the plateform after 2015. The current usage metrics is available 48-96 hours after online publication and is updated daily on week days.
Initial download of the metrics may take a while.