Fig. 2
Download original image
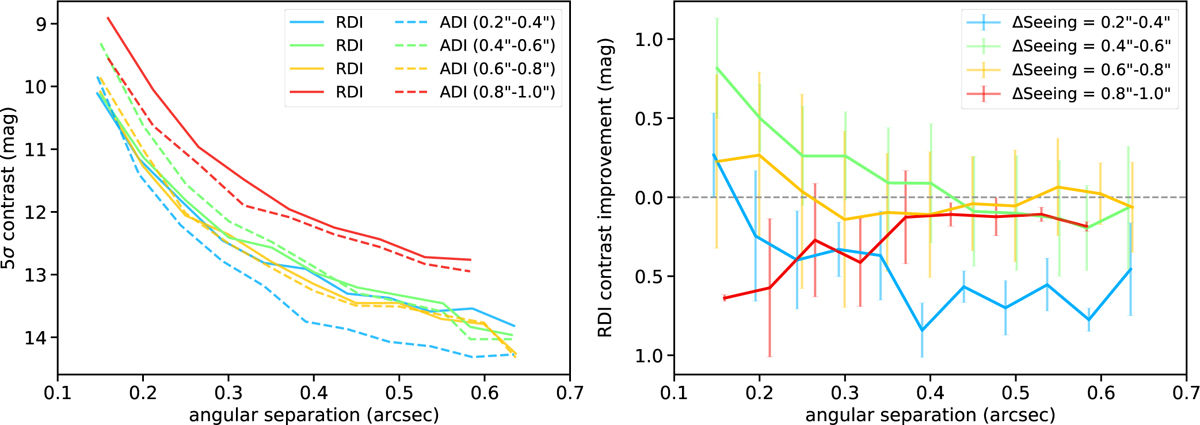
Comparison of RDI and ADI contrasts. Left panel: contrast curves (5σ) for the selected sample with the RDI (solid lines) or ADI (dashed lines) reduction, averaged over targets in each bin of seeing conditions. Right panel: RDI contrast improvement over ADI. The error bar represents the scatter of the RDI improvements of the targets in each bin. Four bins of seeing conditions were used.
Current usage metrics show cumulative count of Article Views (full-text article views including HTML views, PDF and ePub downloads, according to the available data) and Abstracts Views on Vision4Press platform.
Data correspond to usage on the plateform after 2015. The current usage metrics is available 48-96 hours after online publication and is updated daily on week days.
Initial download of the metrics may take a while.