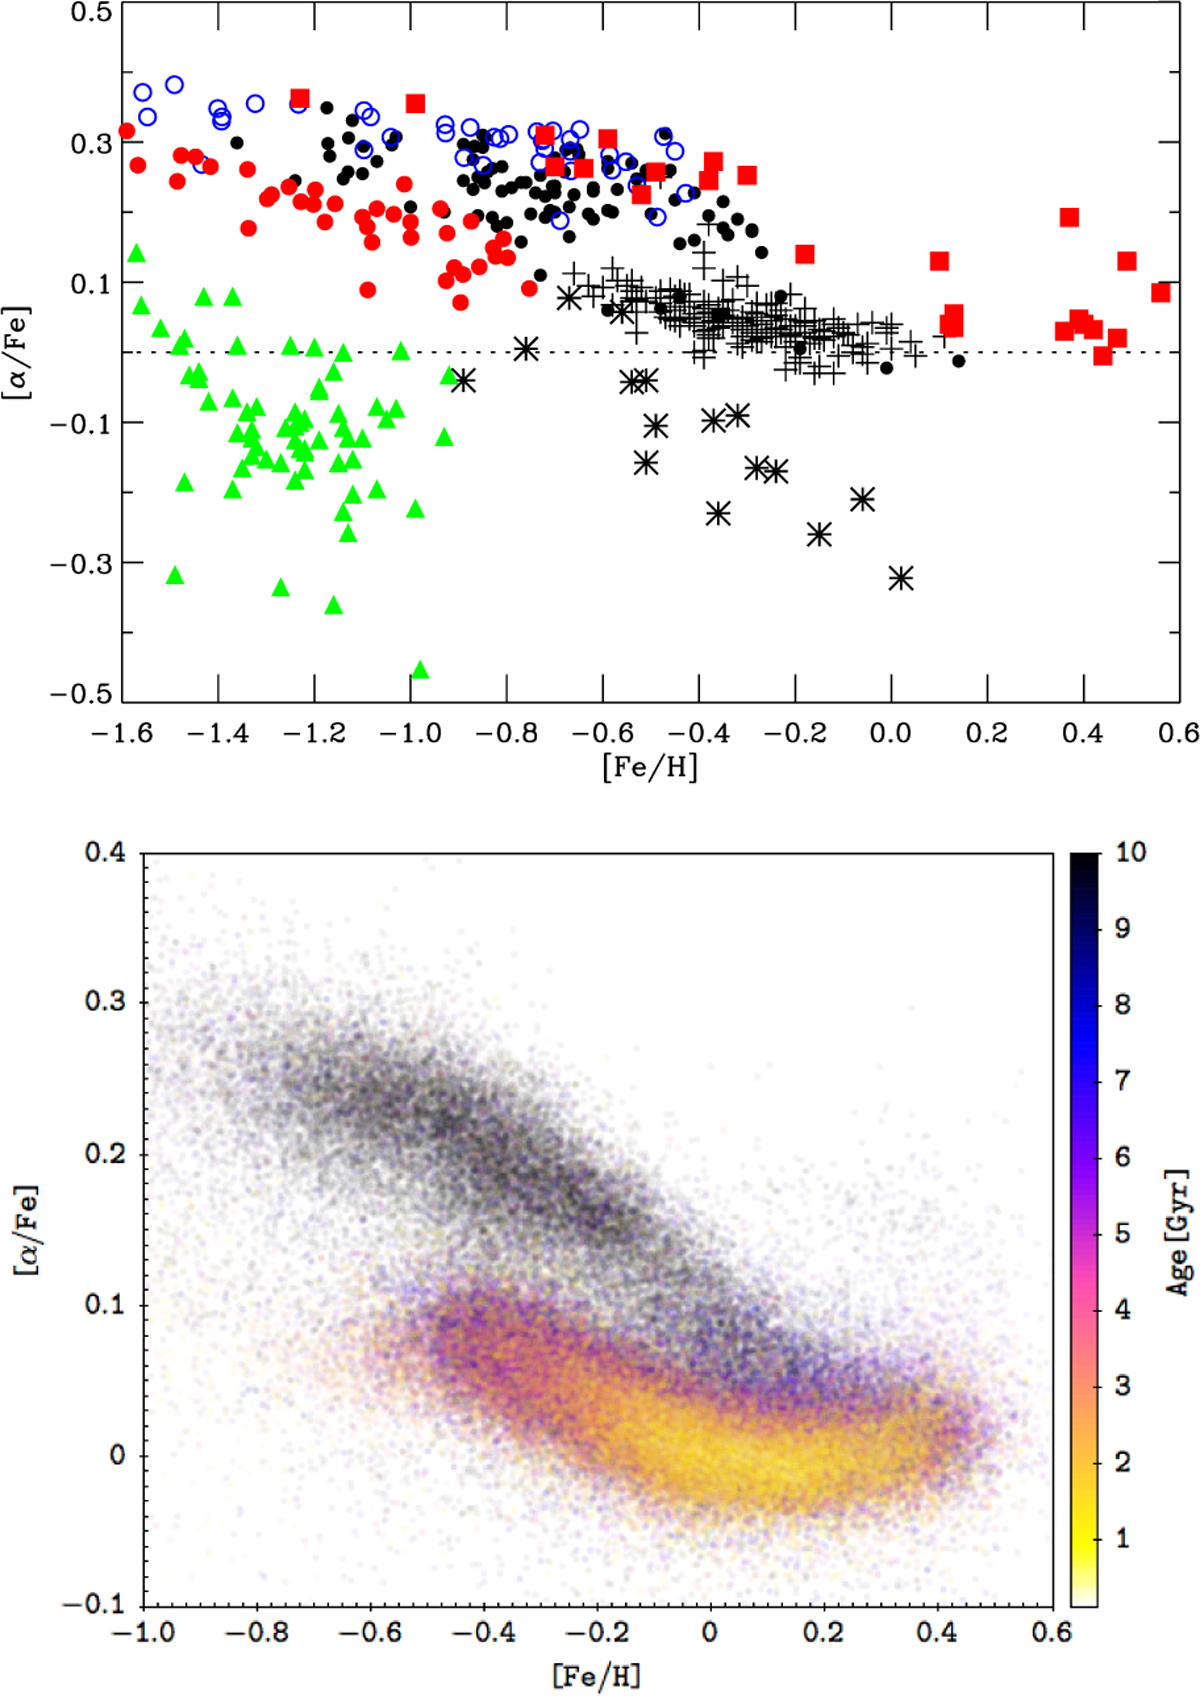
Fig. 2
Download original image
[α/Fe] vs. [Fe/H] for various stellar populations. Upper: thin-disc stars from Reddy et al. (2003) are shown with plus symbols. Filled circles refer to thick-disc stars from Reddy et al. (2006) and Nissen & Schuster (2010). Filled (red) squares are microlensed bulge stars from Bensby et al. (2011). Open (blue) circles are high-α and filled (red) circles low-α halo stars from Nissen & Schuster (2010). Asterisks refer to stars in the Sagittarius dSph galaxy (Sbordone et al. 2007), and filled (green) triangles show data for stars in the Sculptor dSph galaxy from Kirby et al. (2009), for which the precision of [α/Fe] is better than 0.15 dex. This figure is taken from Nissen (2013). Lower: [α/Fe] vs. [Fe/H] for various stellar populations, colour coded by age derived from the [C/N] chronometer calibrated from Gaia-ESO observed open clusters. The distinction between the high-alpha thick disc and the low-alpha thin disc is manifest. Also apparent is the age gradient down the thick disc sequence, continued in age after a discontinuous jump in [Fe/H] to [Fe/H] =−0.6 This identifies the last major merger in the Milky Way. This figure is taken from Casali et al. (2019).
Current usage metrics show cumulative count of Article Views (full-text article views including HTML views, PDF and ePub downloads, according to the available data) and Abstracts Views on Vision4Press platform.
Data correspond to usage on the plateform after 2015. The current usage metrics is available 48-96 hours after online publication and is updated daily on week days.
Initial download of the metrics may take a while.