Fig. 4
Download original image
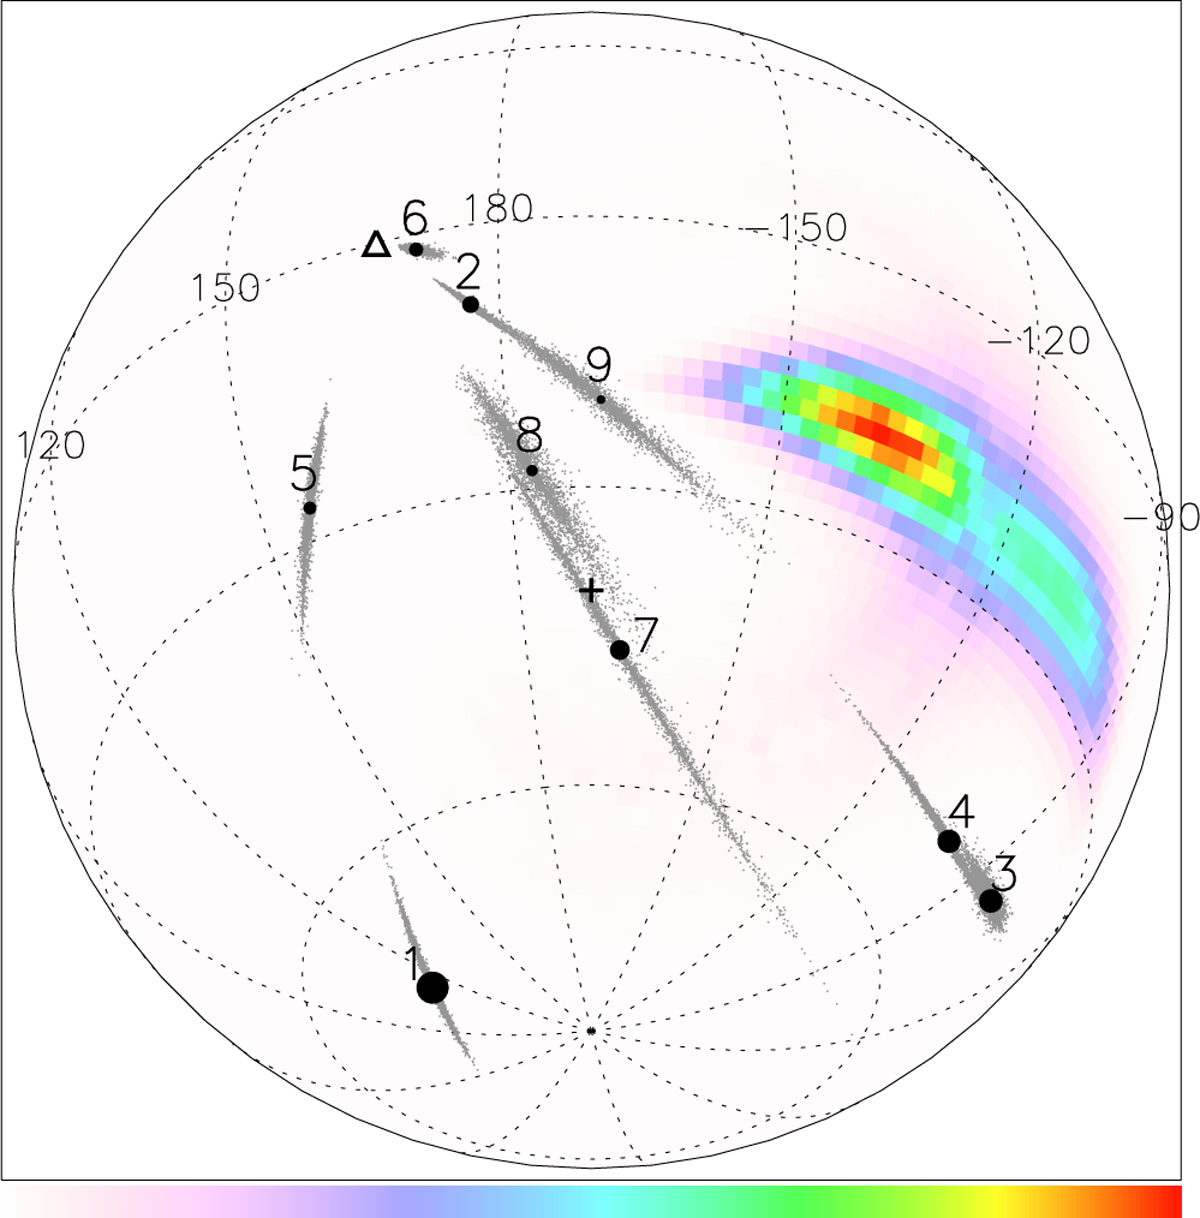
Directions of ejection velocities in the ecliptical coordinate system. The origin of the coordinate system coincides with fragment 0, which is also the parent body of the cluster. The black dots with numbers represent the ejection velocity directions of the fragments belonging to the nominal cluster (the size of the dot corresponds to the fragment size) and the black cross in the center of the plot is the mean ejection direction. The gray color is used to show the ejection velocity directions of the cluster clones. For a better view, only 1000 clones are displayed. The triangle shows the position of the Sun. The flux of the small meteoroids’ incident on the parent meteoroid is shown by the color scale. This flux was determined using NASA’s Meteoroid Engineering Model 3 (Moorhead et al. 2020).
Current usage metrics show cumulative count of Article Views (full-text article views including HTML views, PDF and ePub downloads, according to the available data) and Abstracts Views on Vision4Press platform.
Data correspond to usage on the plateform after 2015. The current usage metrics is available 48-96 hours after online publication and is updated daily on week days.
Initial download of the metrics may take a while.