Fig. 4
Download original image
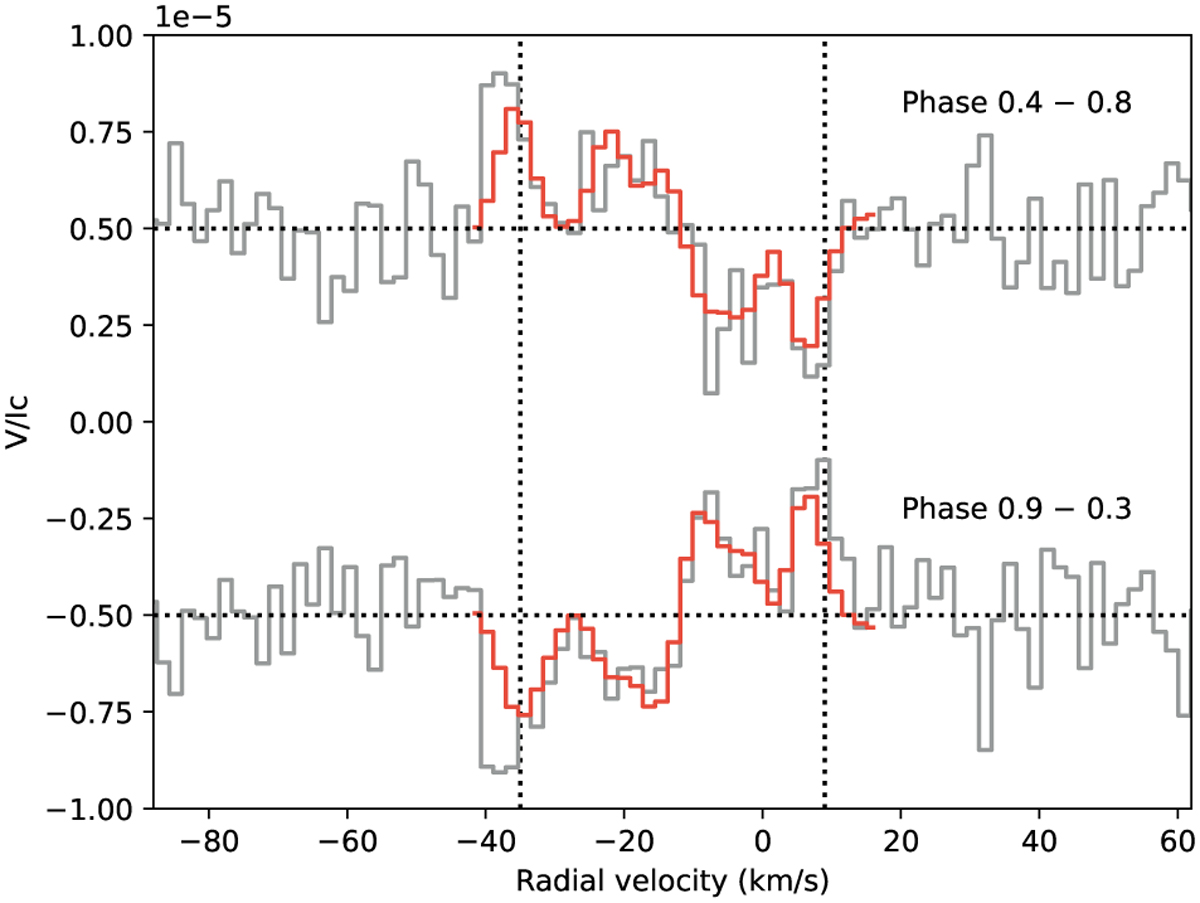
Top plot: averaged LSD profiles obtained by selecting phases close to the positive pole of the dipole (phases between 0.4 and 0.8). The grey line shows observations, while the red line illustrates synthetic profiles produced by the ZDI model. The average of all available profiles (red curve in Fig. 1) has been subtracted from observations and models to remove as much as possible the signature of the polar spot. Bottom plot: same, around the negative pole of the dipole (phases from 0.9 to 0.3). The dashed vertical lines mark the ± v sin i limit. The top and bottom plots were shifted vertically for a clearer display, with dashed horizontal lines showing the zero level.
Current usage metrics show cumulative count of Article Views (full-text article views including HTML views, PDF and ePub downloads, according to the available data) and Abstracts Views on Vision4Press platform.
Data correspond to usage on the plateform after 2015. The current usage metrics is available 48-96 hours after online publication and is updated daily on week days.
Initial download of the metrics may take a while.