Fig. 3
Download original image
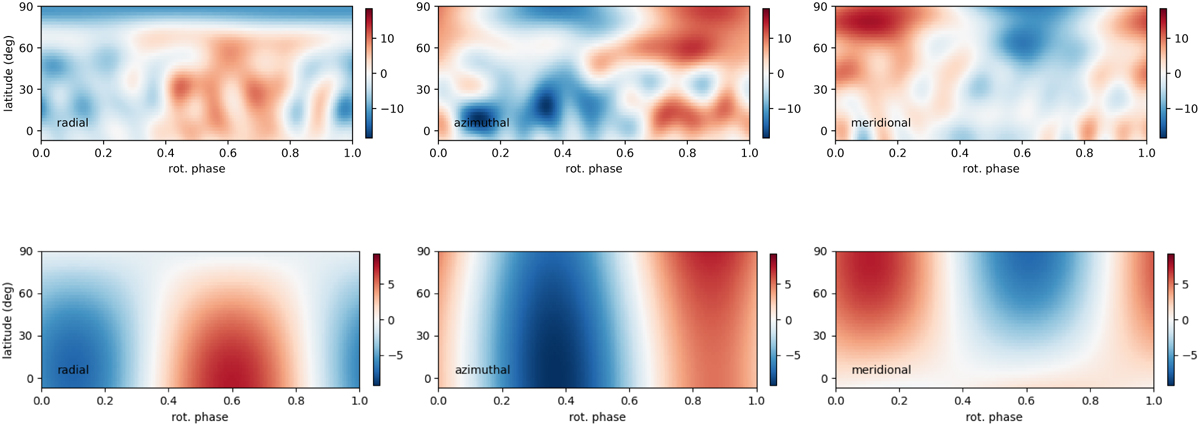
Magnetic map obtained after grouping all data together (top). The three charts illustrate the radial, azimuthal and meridional components of the local magnetic vector. The field strength is expressed in gauss. The bottom map is obtained from the full data set, but limiting the spherical harmonics expansion to ℓmax = 1. Note that the latitudinal extent of the maps is limited to the visible fraction of the stellar surface (at an inclination angle of 6.4°).
Current usage metrics show cumulative count of Article Views (full-text article views including HTML views, PDF and ePub downloads, according to the available data) and Abstracts Views on Vision4Press platform.
Data correspond to usage on the plateform after 2015. The current usage metrics is available 48-96 hours after online publication and is updated daily on week days.
Initial download of the metrics may take a while.