Open Access
Fig. 1
Download original image
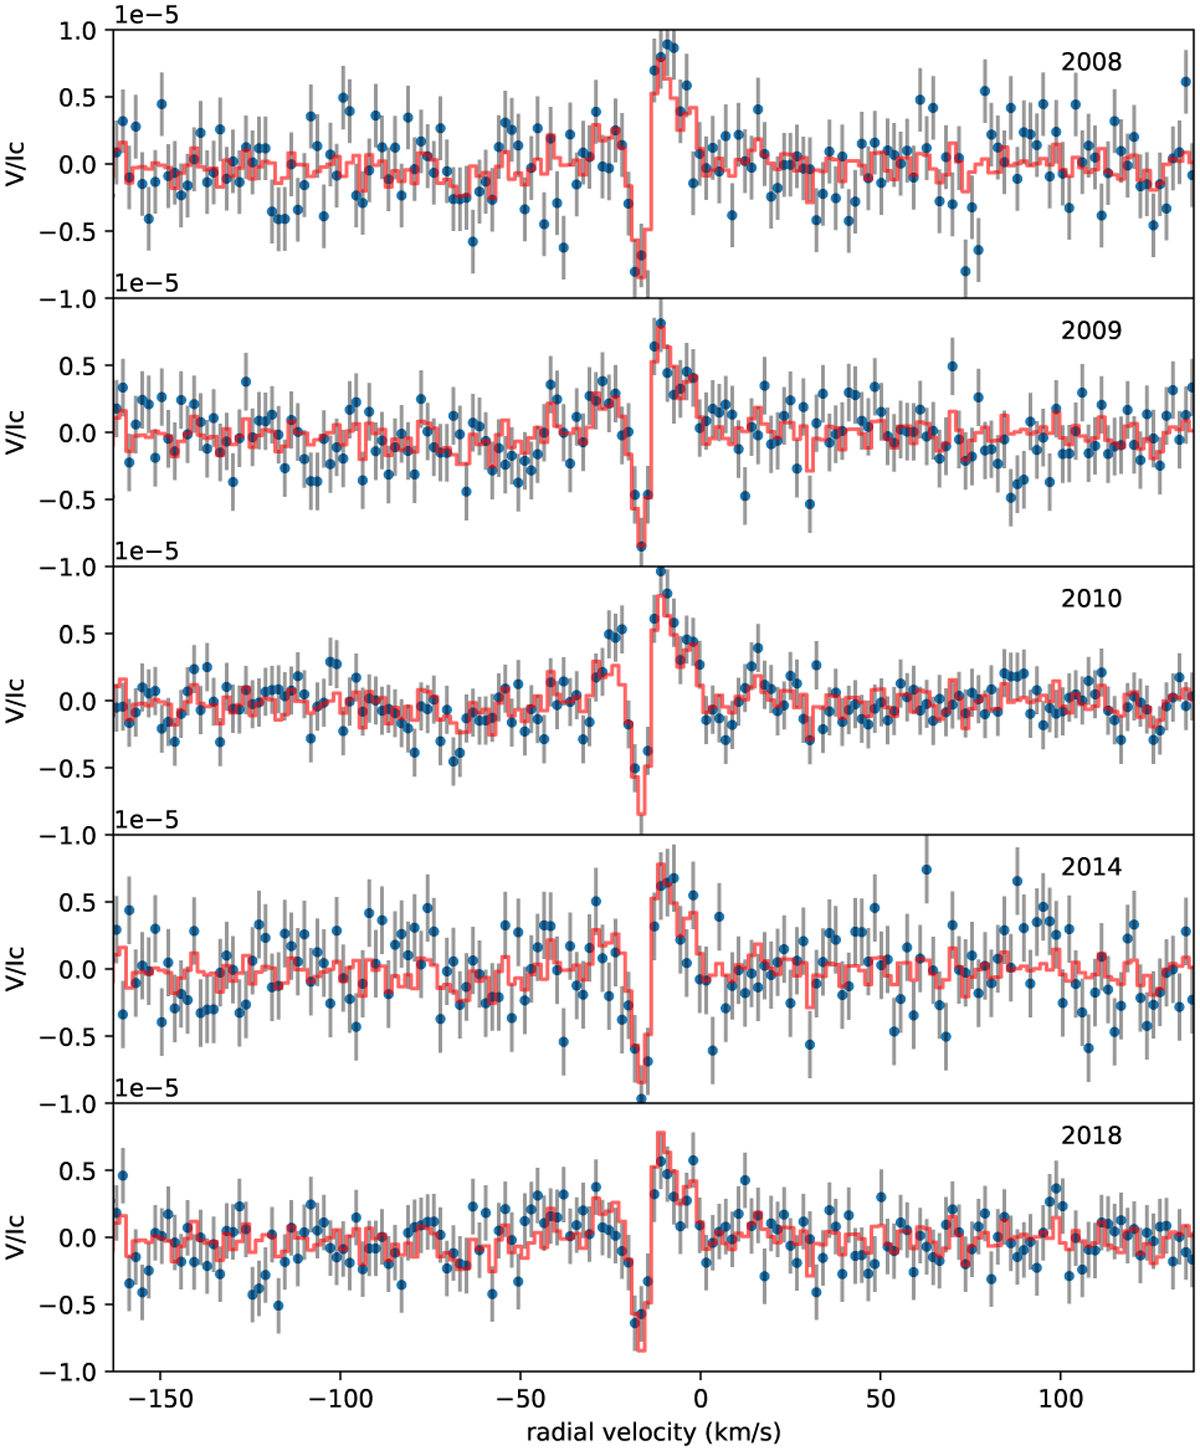
Averaged Stokes V LSD pseudo-profiles. Observations for each observing epoch are plotted as blue symbols, with the year of observation indicated in the right upper part of the plots. For each epoch, we over-plot in red the signature obtained by averaging all available data together.
Current usage metrics show cumulative count of Article Views (full-text article views including HTML views, PDF and ePub downloads, according to the available data) and Abstracts Views on Vision4Press platform.
Data correspond to usage on the plateform after 2015. The current usage metrics is available 48-96 hours after online publication and is updated daily on week days.
Initial download of the metrics may take a while.