Fig. 9
Download original image
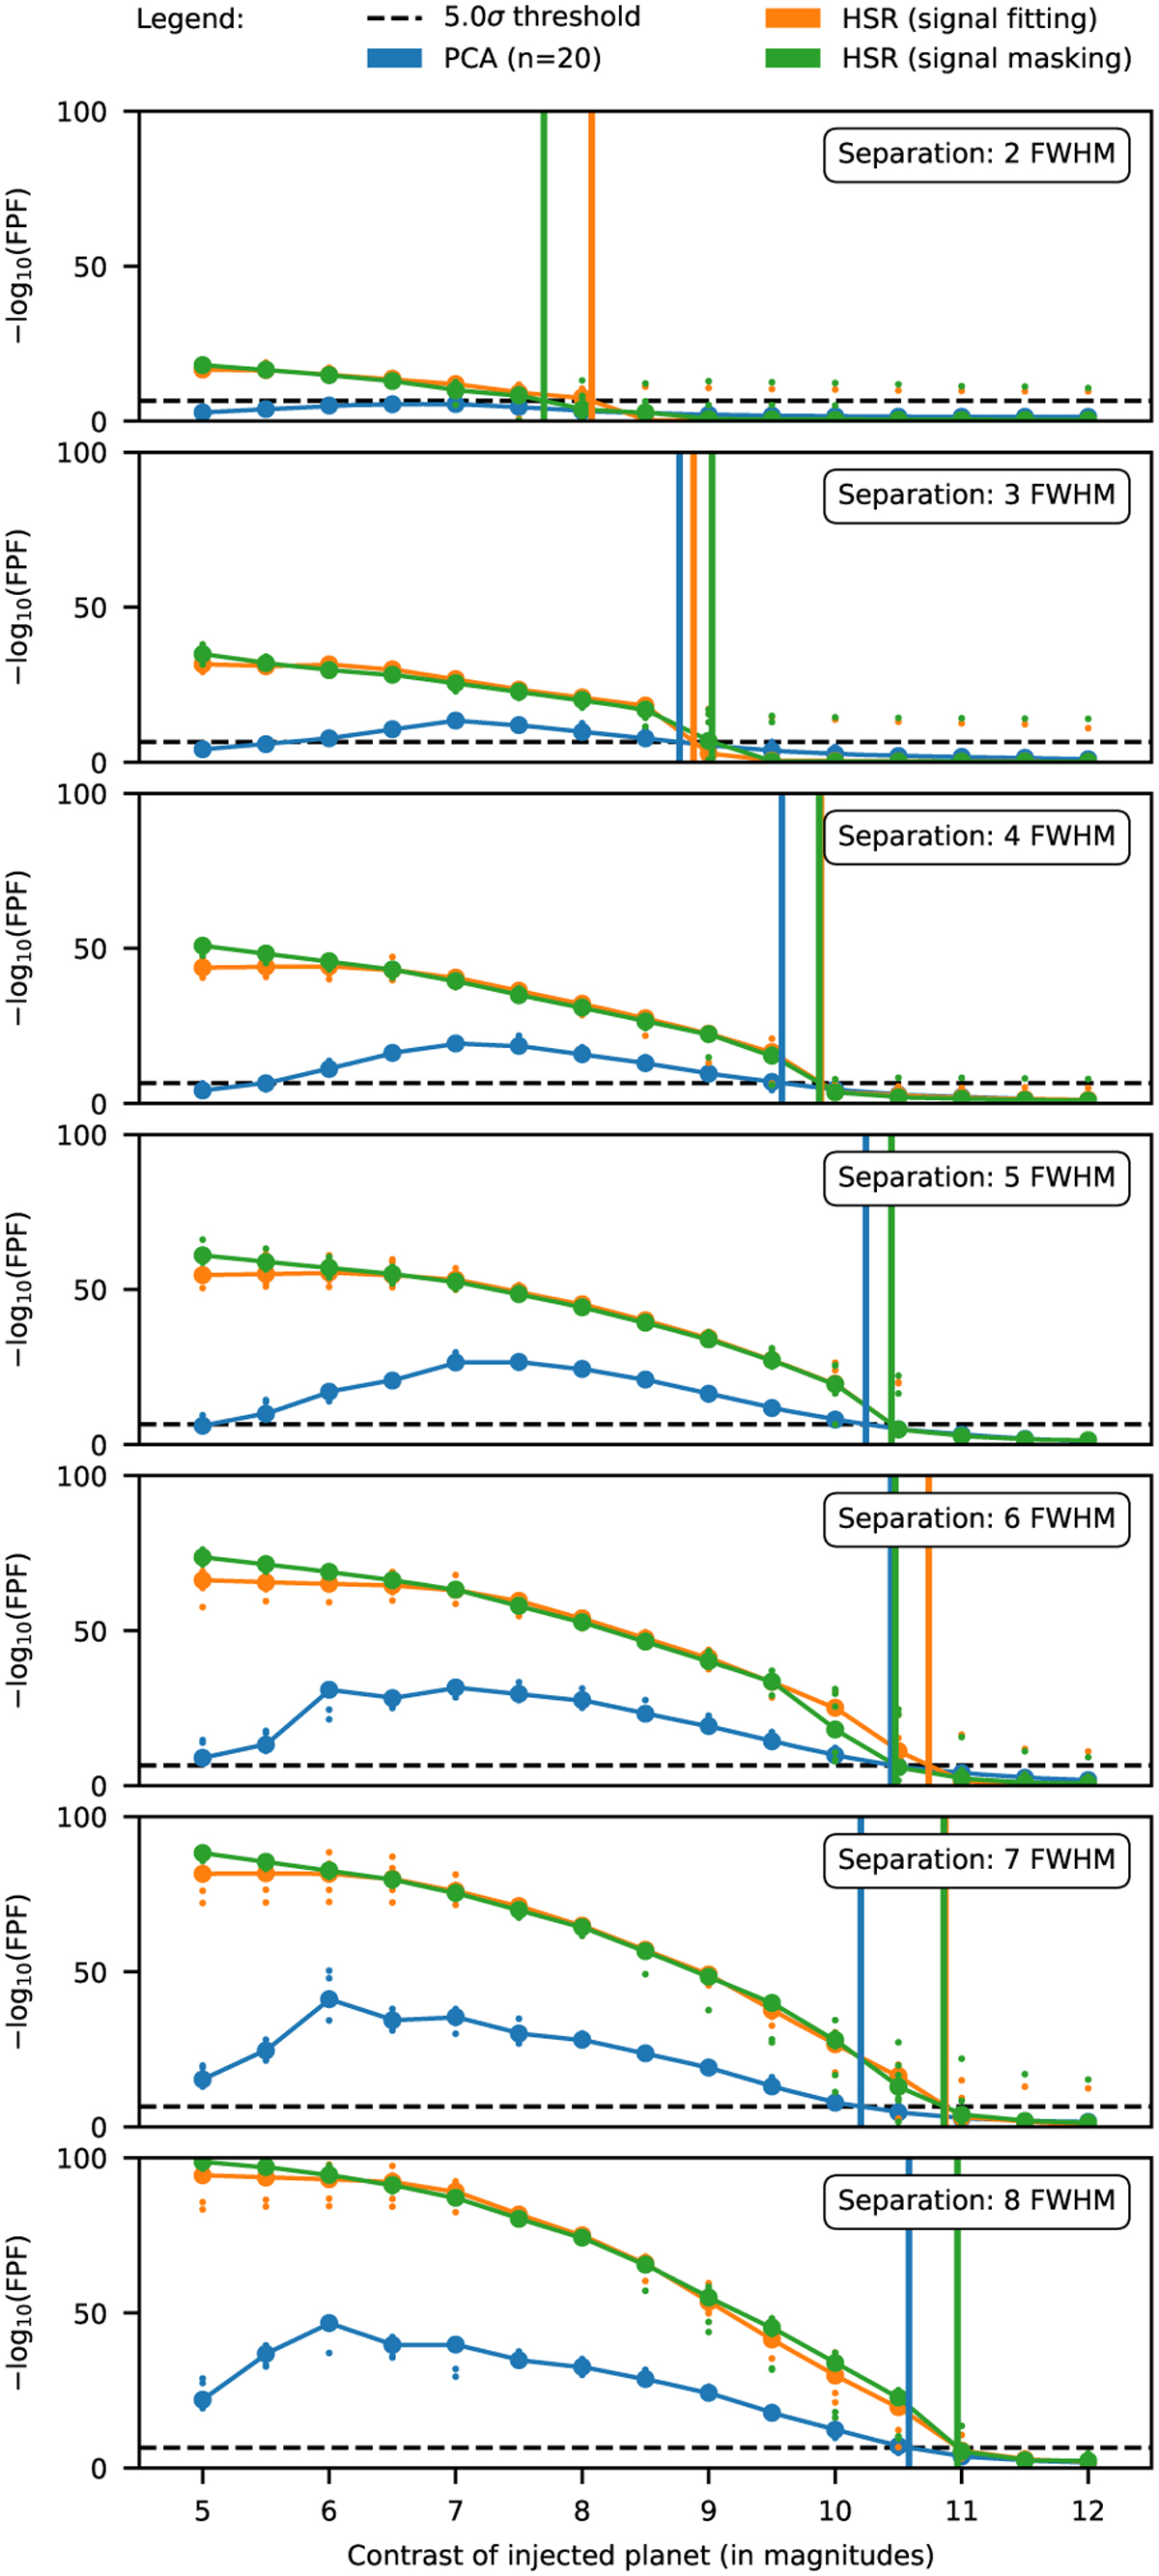
To compute the contrast curves shown in Fig. 8, we linearly interpolate, for each separation, the negative logarithm of the false positive fraction (which we compute as the average across 6 azimuthal positions). Then, we determine the contrast value at which the −log10(FPF) score crosses the 5σ threshold and mark these points by a vertical line. This is the contrast curve. We note that there is no simple linear relationship between the maximum −log10(FPF) score and the point at which the −log10(FPF) values cross the threshold, demonstrating clearly why the FPF (or S/N) of a single, given planet generally does not allow statements about the achievable detection limits on that data set. □
Current usage metrics show cumulative count of Article Views (full-text article views including HTML views, PDF and ePub downloads, according to the available data) and Abstracts Views on Vision4Press platform.
Data correspond to usage on the plateform after 2015. The current usage metrics is available 48-96 hours after online publication and is updated daily on week days.
Initial download of the metrics may take a while.