Fig. 8
Download original image
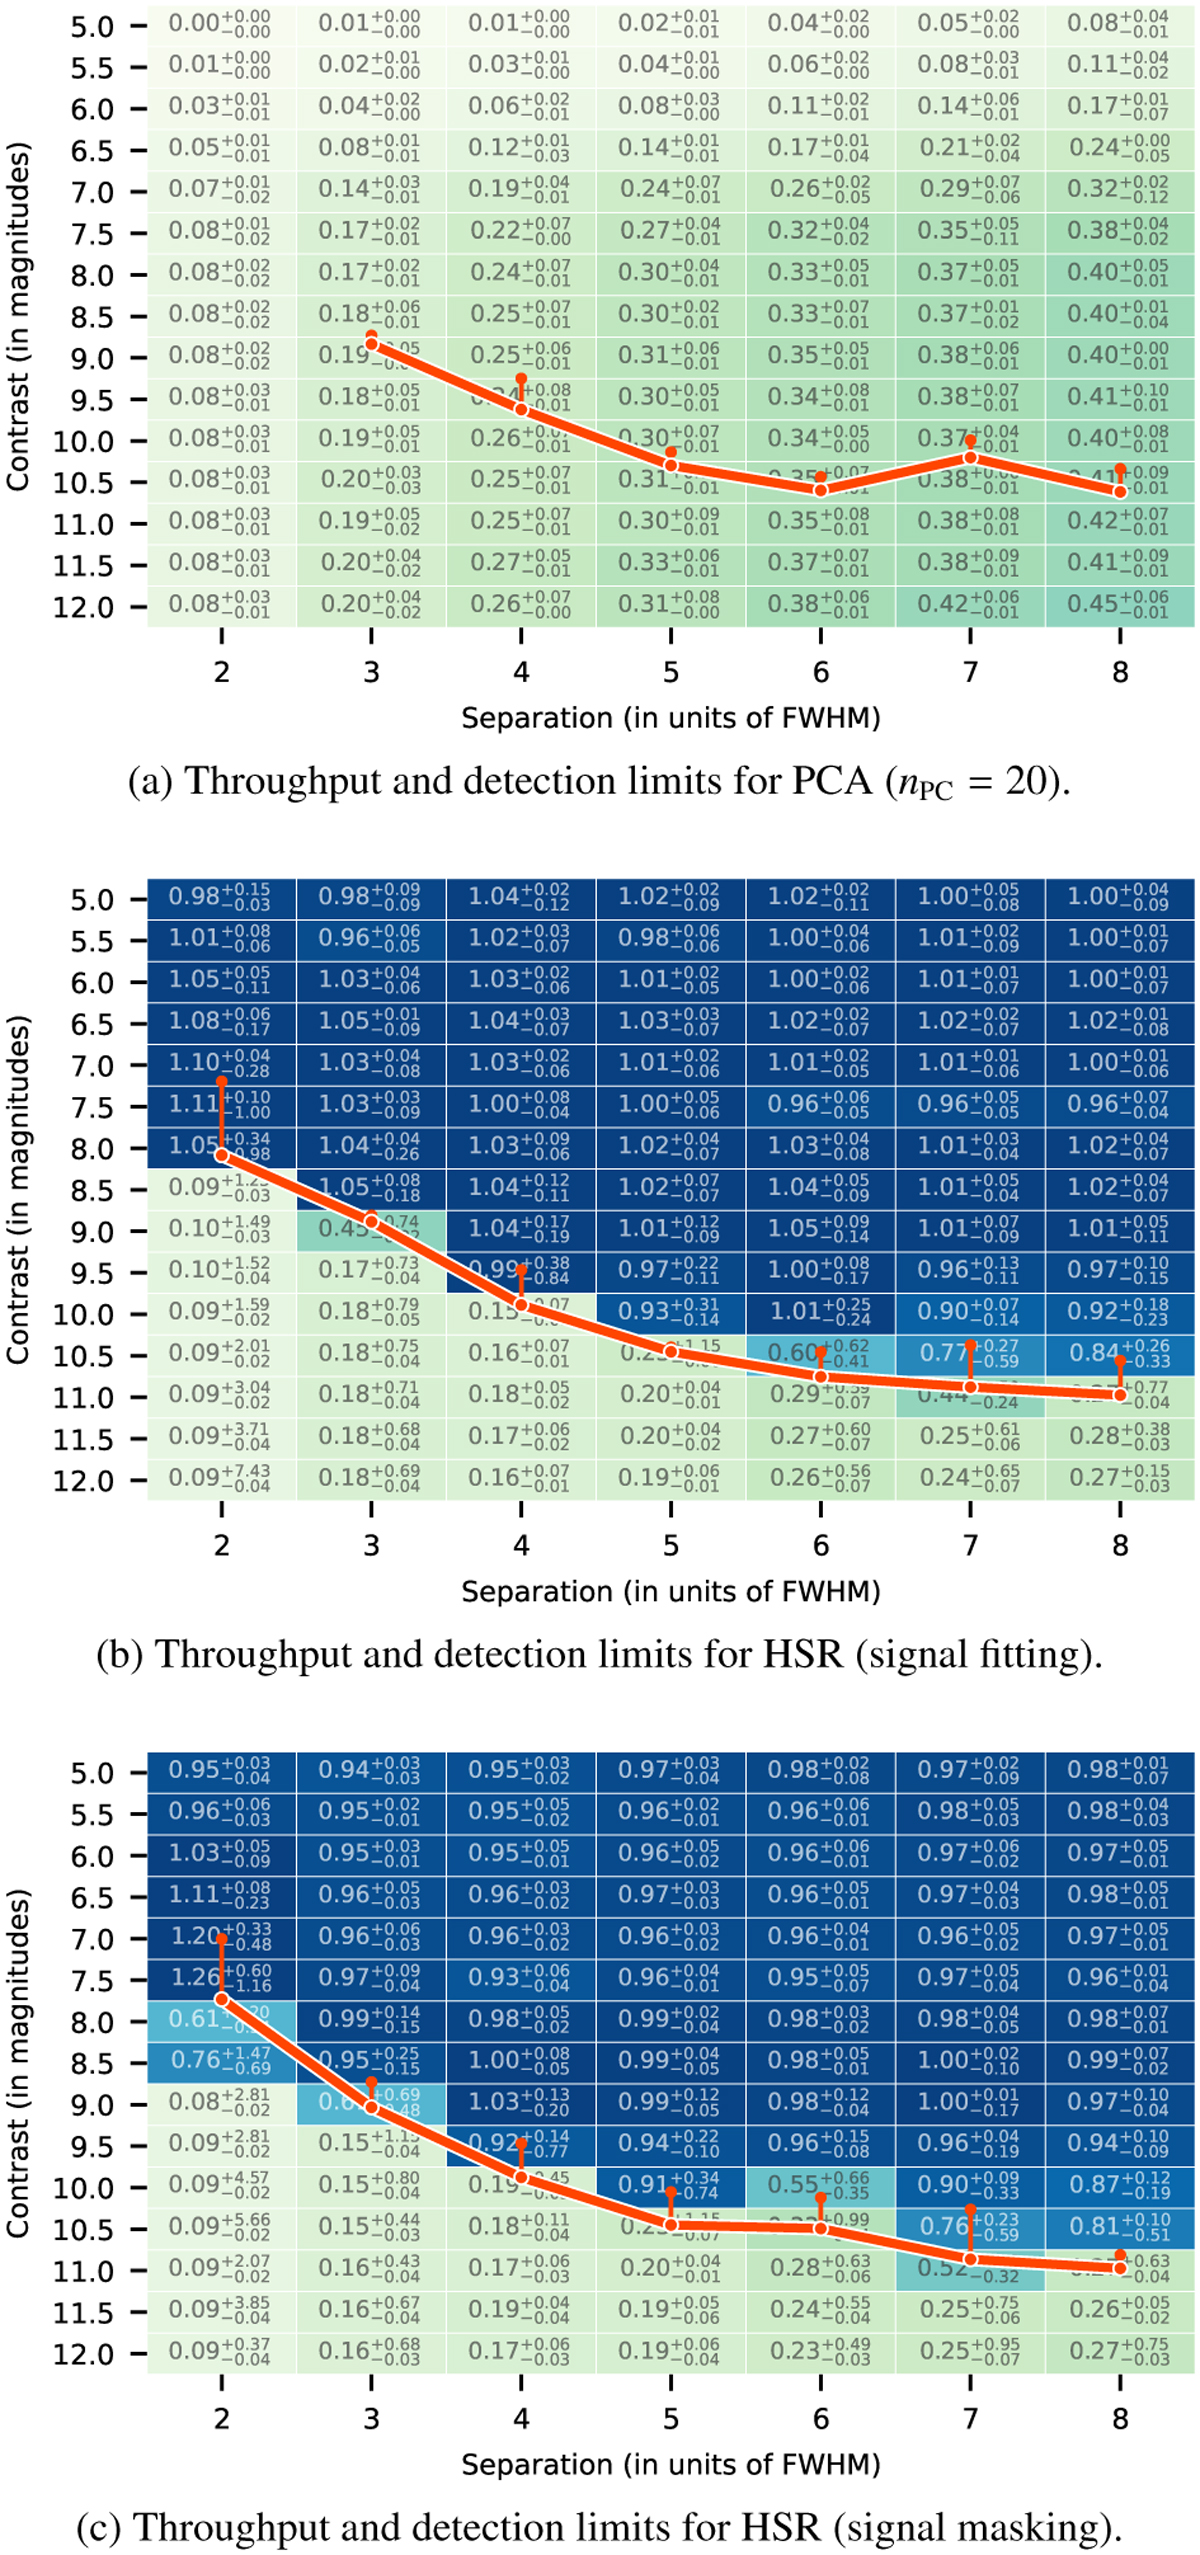
Results of experiment in Sect. 5.3 (for the Beta Pictoris L′ data set). The table plots show the ratio of the observed flux from the signal estimate and the injected flux as a function of contrast and separation, averaged over six azimuthal positions. Values close to 1 indicate that the signal estimate provides a good estimate for the planet’s brightness. Overlaid in orange is the respective 5σ contrast curve for each method, including a marker that indicates the respective worst-case (i.e., the contrast curve that we obtain if we aggregate the data azimuthally by using the position with the highest FPF). For PCA, the contrast curve begins at 3 FWHM because, for 2 FWHM, none of the injected planets ever crosses the 5σ threshold for the FPF. □
Current usage metrics show cumulative count of Article Views (full-text article views including HTML views, PDF and ePub downloads, according to the available data) and Abstracts Views on Vision4Press platform.
Data correspond to usage on the plateform after 2015. The current usage metrics is available 48-96 hours after online publication and is updated daily on week days.
Initial download of the metrics may take a while.