Fig. 4
Download original image
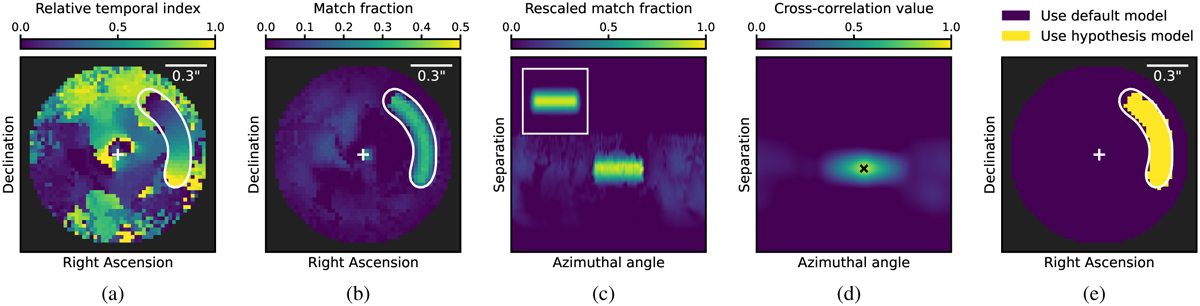
Outputs of the different steps of stage 2: (a) hypothesis map, (b) match fraction map, (c) polar match fraction map with expected signal template (in upper-left corner), (d) cross-correlation between the polar match fraction match and the expected signal template, and (e) residual selection mask. The white lines in (a), (b), and (e) indicate the true trajectory of the planet in the data. We notice several things: In (a), the pixels on the true planet trajectory show a clear gradient from early to late that matches the planet’s movement. In (b), we then find that only these pixels produce a high match fraction, meaning that only their hypotheses are consistent with the rest of the data. Finally, in (e), we see a residual selection mask that matches the true planet trajectory almost perfectly. □
Current usage metrics show cumulative count of Article Views (full-text article views including HTML views, PDF and ePub downloads, according to the available data) and Abstracts Views on Vision4Press platform.
Data correspond to usage on the plateform after 2015. The current usage metrics is available 48-96 hours after online publication and is updated daily on week days.
Initial download of the metrics may take a while.