Fig. 3
Download original image
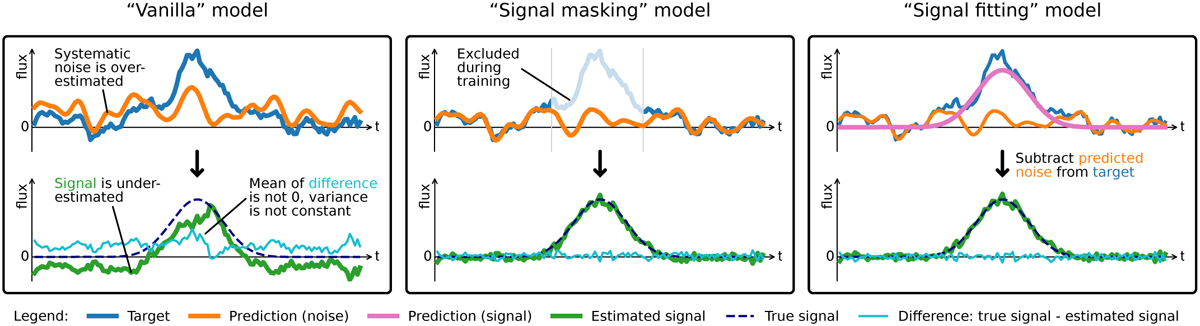
Effect of the expected value of the planet signal on vanilla HSR for a target pixel that contains a planet exactly at half-time of the observation illustrated for three different models: vanilla HSR, signal masking, and signal fitting. For clarity, and to separate the effect from the impact of overfitting, we work with a toy model where the target time series is a weighted sum of an artificial planet signal, three predictor time series (the sum of which we call the systematic noise), and another time series consisting solely of white noise (the stochastic noise). We train a standard linear regression model (ordinary least squares) by regressing the target time series onto the three predictor time series. For the vanilla HSR model, we use the entire target time series for training. For the signal masking model, we exclude all time steps at which the true signal time series exceeds 20% of its maximum (indicated by the shaded region). Finally, for the signal fitting model, we add the true signal time series as an additional predictor to the model. We then apply the trained model to the entire predictor time series to predict the noise (shown in orange). For the signal fitting model, we have to set the coefficient corresponding to the predictor containing the true signal to 0 to get the “noise only” prediction. Once we have the prediction for the noise, we subtract it from the target to get our estimate for the signal, shown in green on the bottom row. We find an excellent agreement between the estimated and the true signal for the signal masking and signal fitting models. For the vanilla model, we observe that the presence of the planet signal has two effects, which we describe in the main text.
Current usage metrics show cumulative count of Article Views (full-text article views including HTML views, PDF and ePub downloads, according to the available data) and Abstracts Views on Vision4Press platform.
Data correspond to usage on the plateform after 2015. The current usage metrics is available 48-96 hours after online publication and is updated daily on week days.
Initial download of the metrics may take a while.