Fig. 12
Download original image
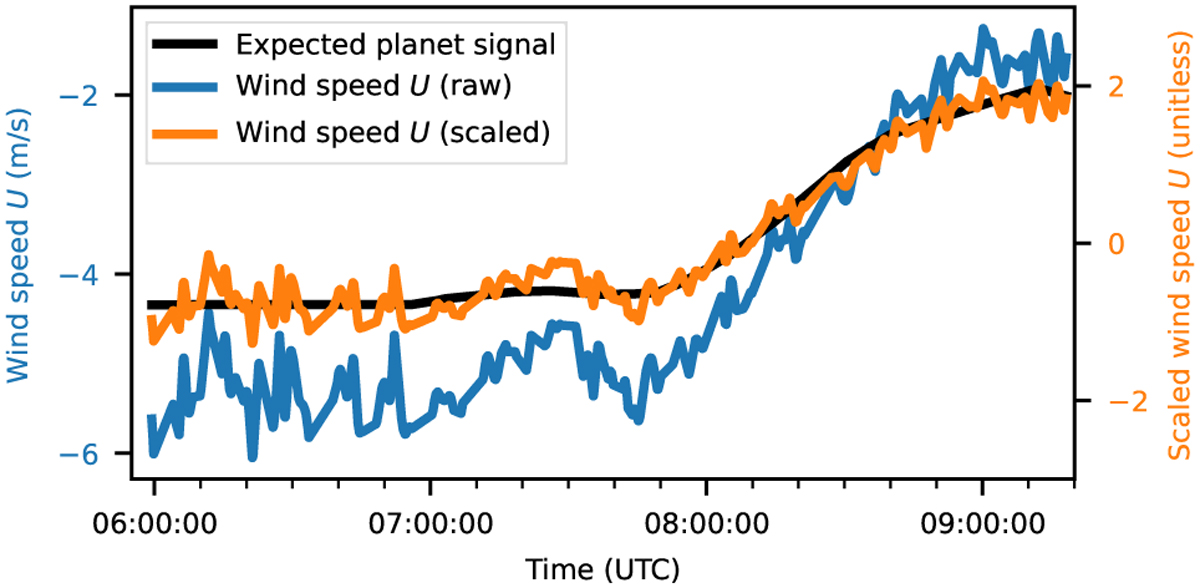
Example (based on the R CrA L′ data set) of a significant yet coincidental correlation between an observing condition (in this case: the U component of the wind speed) and the expected signal time series for a pixel that contains a planet at the end of the observation. The correlation coefficient here is 0.98. To make the correlation more easily visible, we add a normalized and scaled version of the wind speed (in orange). □
Current usage metrics show cumulative count of Article Views (full-text article views including HTML views, PDF and ePub downloads, according to the available data) and Abstracts Views on Vision4Press platform.
Data correspond to usage on the plateform after 2015. The current usage metrics is available 48-96 hours after online publication and is updated daily on week days.
Initial download of the metrics may take a while.