Open Access
Fig. 8.
Download original image
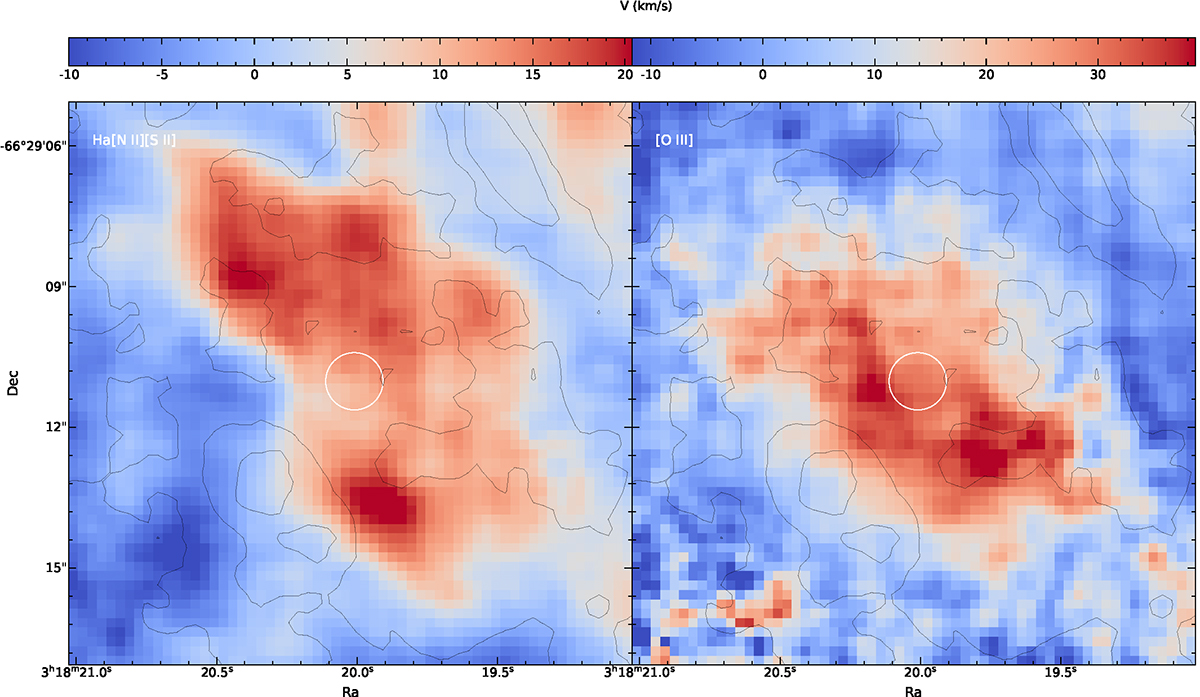
Close-up view of the velocity maps for the Hα[N II][S II] (left) and [O III] maps (right). Note the difference in scale between the two maps. The position of the ULX is indicated with a white circle. Contours as per Fig. 7.
Current usage metrics show cumulative count of Article Views (full-text article views including HTML views, PDF and ePub downloads, according to the available data) and Abstracts Views on Vision4Press platform.
Data correspond to usage on the plateform after 2015. The current usage metrics is available 48-96 hours after online publication and is updated daily on week days.
Initial download of the metrics may take a while.